Propagation of regional seismic phases (Lg and Sn) and Pn velocity structure along the Africa-Iberia plate boundary zone: Tectonic implications
Alexander Calvert, Eric Sandvol, Dogan Seber, and Muawia Barazangi
Institute for the Study of the Continents and Department of Geological Sciences
Cornell University, Ithaca, New York 14853
Francisco Vidal
Instituto Geografico Nacional, Madrid, Spain
and Instituto Andaluz de Geofisica, Granada, Spain
Gerardo Alguacil
Instituto Andaluz de Geofisica, Granada, Spain
Nacer Jabour
Centre National de Coordination et de Planification de la Recherche Scientifique et Technique, Rabat, Morocco
Abbreviated title: Structure of Africa-Iberia plate boundary
Summary
We used over 1000 regional waveforms recorded by 60 seismic stations located in northwest Africa and Iberia to map the efficiency of Lg and Sn wave propagation beneath the Gulf of Cadiz, Alboran Sea and bounding Betic, Rif and Atlas mountain belts. Crustal attenuation is inferred from the tomographic inversion of Lg/Pg amplitude ratios. Upper mantle attenuation is inferred from maps of Sn propagation efficiency derived by inversion of well-defined qualitative efficiency assignments based on waveform characteristics. Regions of Lg attenuation correlate well with areas of thinned continental or oceanic crust, significant sedimentary basins, and lateral crustal variations. Comparison of the Sn efficiency results with velocities obtained from an anisotropic Pn travel time inversion shows a fairly good correlation between regions of poor Sn efficiency and low Pn velocity. A low Pn velocity (7.6-7.8 km/s) and significant Sn attenuation in the uppermost mantle is imaged beneath the Betics in southern Spain in sharp contrast to the relatively normal Pn velocity (8.0-8.1 km/s) and efficient Sn imaged beneath the Alboran Sea. Slow Pn velocity anomalies are also imaged beneath the Rif and Middle Atlas in Morocco. We do not identify any conclusive evidence of lithospheric scale upper mantle attenuation beneath the Rif although the crust in the Gibraltar region appears highly attenuating, making observations at stations in this region ambiguous. Paths crossing the Gulf of Cadiz, eastern Atlantic and the Moroccan and Iberian Mesetas show very efficient Sn propagation and are imaged with high Pn velocities (8.1-8.2 km/s).
The spatial distribution of attenuation and velocity anomalies lead us to conclude that some recovery of the mantle lid beneath the Alboran Sea must have occurred since the early Miocene episode of extension and volcanism. We interpret the low velocity and attenuating regions beneath the Betics and possibly the Rif as indicating the presence of partial melt in the uppermost mantle that may be underlain by faster less attenuating mantle. In the light of observations from other geophysical and geological studies, the presence of melt at the base of the Betic crust may be an indication that delamination of continental lithosphere has played a role in the Neogene evolution of the Alboran Sea region.
Key words: Propagation, Attenuation, Guided waves, Tomography, Seismology, Spain, Morocco, Alboran Sea
1 Introduction
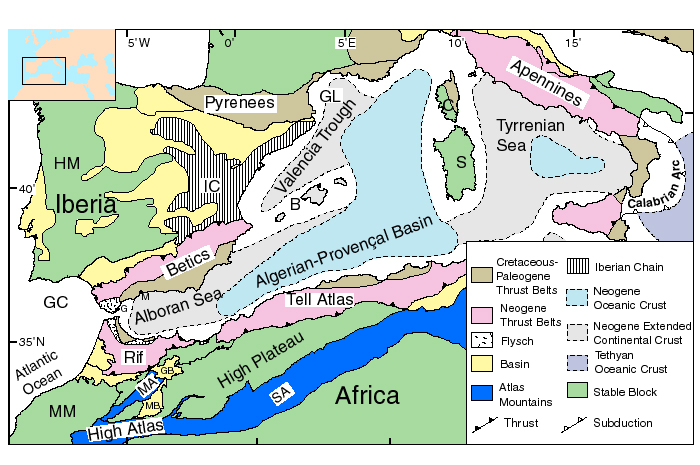
The evolution of the western Mediterranean remains difficult to explain with a simple plate tectonics based model. It is floored by extended continental and oceanic crust of Neogene age (Fig. 1) and surrounded on all sides by Alpine mountain belts. The peripheries of these belts were thrust while the central regions were undergoing extension. This coeval extension and contraction occurred in an overall environment of N-S to NW-SE convergence between Africa and Eurasia . This intriguing pattern of deformation, coupled with the apparent collapse of an intervening Paleogene mountain belt of significant crustal thickness has resulted in the proposal of a variety of evolutionary models. These models range from more traditional subduction models, suggesting that extension was driven by the foundering and retreat or break-off of a subducting oceanic plate , to convective removal or delamination models proposing that extension was initiated by detachment of over thickened continental lithosphere. These processes are not mutually exclusive. Good evidence exists of subduction being the predominant Neogene process along the Calabrian arc. However, convective removal or delamination seem more probable in the Alboran Sea region in the west. We use tomographic methods to map Lg and Sn propagation efficiency and Pn velocities, and discuss the implications of these observations in light of results from previous studies for the present lithospheric structure and evolution of this enigmatic region.
1.1 Tectonic setting
The western Alboran Sea is bounded by the arcuate Spanish Betic and Moroccan Rif mountain belts (Fig.1). These mountains are typically subdivided into Internal and External zones owing to a pronounced difference in timing and style of deformation. A region of highly deformed flysch separates these zones in the western Betics and Rif (Fig. 1). The Internal zones are believed to be fragments of a collisional mountain belt composed of Mesozoic marine sediments shortened during Cretaceous and Paleogene convergence that used to lie along the coast of SE Spain and France . Extension and collapse of this belt occurred in the early Neogene while thrusting was active in the External zones. Clockwise rotation of the Balearic Islands and counterclockwise rotation of Corsica and Sardinia resulted in formation of the Valencia Trough and Algerian-Provençal Basin . Collapse and westward transport of the block that later formed the Rif and Betic internal zones formed the Alboran Sea basin. Gravity modeling indicates that the continental crust beneath the Alboran Sea ranges from 10-22 km, thinning from W to E and perhaps transitioning to oceanic crust at approximately zero degrees longitude . Drill holes show that the Valencia trough is also floored by extended continental crust . Crustal thicknesses beneath the Betics and Rif are approximately 25-35 km (reaching 38 km in places beneath the Betics). Heatflow readings in the Alboran basin are highly variable with the west Alboran basin averaging 69 mW/m2 and eastern Alboran 124 mW/m2 and are interpreted to indicate an eastward thinning of the lithosphere beneath the Alboran from 50-90 km in the west to 40 km.
Deformation related to the interactions between Africa and Iberia extends over 500 km into NW Africa. The High and Middle Atlas of Morocco were formed by inversion of Mesozoic rifts initiated by the opening of the Atlantic . To the east, with perhaps less pre-existing structure to localize deformation, convergence is accommodated by not only shortening in the Tell Atlas but also by broad uplift of the High Plateau.
Scattered seismicity indicates that active deformation continues to be distributed, although crustal earthquakes are concentrated in the Betic, Rif and Tell mountain belts. Intermediate-depth earthquakes occur predominantly in two regions: (1) A diffuse zone off the coast of Spain in the Gulf of Cadiz , and (2) a concentrated N-S line (~4.5° W) spanning the Alboran Sea and dipping S from crustal depths beneath the Betics to a depth of ~150 km beneath the center of the Alboran Sea . This dipping band of seismicity is overlain by an aseismic zone . A limited number of well-constrained intermediate-depth earthquakes have also been located off the Atlantic coast of northern Morocco and beneath the Rif .
1.2 Regional seismic phases (Lg, Pg, Sn, Pn)
A considerable number of studies have established empirical relationships between the attenuation and velocities of regional waves and the lithospheric structure through which they propagate.
Lg is a crustal guided wave that has been modeled both as higher mode Love and Rayleigh waves and as the superposition of multiply reflected S waves trapped in the crust . Lg is usually found in a group velocity window between 3.6 and 3.0 km/s in a frequency band of 0.5 to 5 Hz. Although sensitive to the intrinsic attenuation and scattering characteristics of the crust through which it propagates, Lg is also sensitive to the shape and lateral variations of the crustal wave guide . It is significantly attenuated or even blocked by rapid changes in crustal thickness and by thick sedimentary cover . Regions of thin crust, either severely thinned continental or oceanic crust, also prevent Lg propagation .
Pg is perhaps the most simple regional phase consisting of direct P wave energy from a crustal earthquake and compared to Lg is reasonably insensitive to crustal structure. Pg is usually found in a velocity window between 6.5 and 5.0 km/s.
Sn is also a guided wave but it travels in the mantle portion of the lithosphere or mantle lid. It travels at velocities between 4.7 and 4.3 km/s, may contain frequency components in excess of 20 Hz, and has been observed out to distances of 35 degrees . Sn propagation efficiency is sensitive to the velocity gradient and attenuation in the mantle lid and hence to its temperature and thickness.
Pn consists of P-wave energy guided in the mantle lid. Generally regions of slower Pn (7.5 7.9 km/s) are associated with regions of warm or absent mantle lithosphere or the presence of melt . The presence of significant anisotropy in the mantle has been known for some time , but multiple mechanisms appear to produce anisotropy making interpretation of the causes difficult. Recently, tomographic inversions of travel time data have also included anisotropy components with some studies indicating a need to allow for anisotropy to correctly image even the isotropic velocity structure .
2 Lg AND Sn PROPAGATION EFFICIENCY DATA
1000 digital waveforms were selected from a larger dataset of over 4000 waveforms collected from all available sources in the Alboran region including both regional networks (~ 50 stations) and 7 broadband stations (Fig. 2). Data from the Spanish networks were provided by the Instituto Geografico Nacional (IGN) in Madrid and the Instituto Andaluz de Geofisica (IAG) in Granada. Data from the Moroccan national network were provided by the Centre National de Coordination et de Planification de Recherche Scientifique et Technique (CNR) in Rabat. These stations are predominantly short period (1 Hz) vertical-component seismometers with sample rates of 100 samples per second (SPS). The 3-component broadband stations are administered by a number of institutions (IGN, MEDNET, GEOFON, and University of Madrid). Data for TOL, PAB, MEB, MTE, SFUC and MDT were obtained from IRIS and recent data from SFUC and CART from GEOFON. The broadband signals are digitized at 20 SPS. Data for events within 20 degrees of the broadband stations were requested using time windows calculated from the USGS Preliminary Earthquake Determination (PDE) bulletin. When reliable locations were available from a previous tomography study , these locations were used otherwise International Seismological Centre (ISC), USGS Earthquake Determination Report (EDR), and IGN and IAG network locations were used.
P first motion picks were made for signals with observable signal in the frequency band 0.5-5 Hz. Time windows (Fig. 3) for Pg (6.2-5.2 km/s), Sn (4.6-4.1 km/s) and Lg (3.6 3.0 km/s) were calculated relative to the first motion using a crustal thickness of 30 km. Regional phases with overlapping time windows resulting from very short ray paths were excluded from the analysis. The beginning of the Sn window was used as a guide for picking an Sn arrival time, and was shifted to the beginning of the Sn arrival where it was observed to ensure that the Sn window sampled the Sn arrival rather than a significant portion of the Pg coda in front of the arrival for slow Sn paths. The end of the Sn window was left unchanged at 4.1 km/s.
3 Qualitative efficiencies and waveform examples
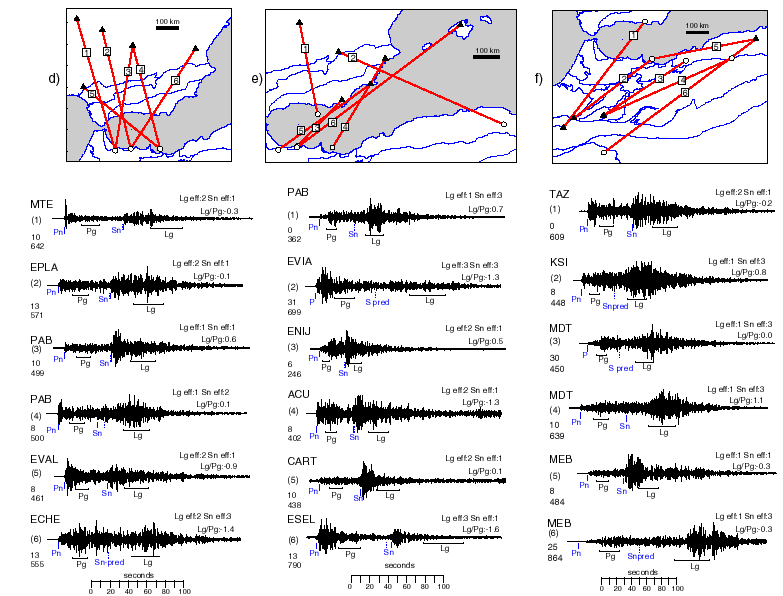
Five classifications are used to qualitatively rank the efficiency of Lg and Sn propagation along each ray path (Table 1 and Fig. 3). Lg efficiency was classified by comparing the waveform in the Lg window with the rest of the waveform (in particular Pg). If Lg amplitudes were twice or greater than Pg it was ranked "efficient" (e.g., Fig. 3a.2). If it was of similar order to the Pg size then it was ranked as "inefficient" (e.g., Fig. 3a.1), if it was less than the Pg amplitude it was classified as "very inefficient or blocked" (e.g., Fig. 3a.5).
Paths that showed large impulsive high frequency Sn arrivals (sometimes an order of magnitude larger than any other portion of the waveform) were classified as "efficient" (e.g., Fig. 3a.5). Where Sn was visible, but not so large or was low frequency (< 2 Hz), it was classified as "present" (e.g., Fig 3a.3). When Sn was not visible above background noise or Pg coda, the path was defined as "very inefficient or blocked" (e.g., Fig 3a.2). An additional "not clear" category was used for events with either an emergent or impulsive first motion with fairly consistent amplitudes along the waveform that did not allow classification of the Sn phase even with filtering (e.g., Fig 3c.2). At distances less than 250 km, the Sn arrival time is very close to the Lg window. At these distances, only waveforms with a clear high frequency Sn arrival before Lg were included (e.g., Fig. 3e.3). Where noise or a short station-event distance did not permit classification of one of either Lg or Sn, the "ignore" category was used for that particular phase.
Figure 4 shows the results of applying these classifications to our data.
3.1 Lg observations
No efficient Lg is observed for events occurring in the Atlantic and the center of the Gulf of Cadiz and recorded in Iberia or Africa (Figs. 3a.5, 3b.5, and 3c.5). Events closer to the Iberian continental margin do contain significant energy in the Lg window (e.g., Figs 3a.4 and 3a.6). Lg is efficient in the Iberian and Moroccan Mesetas (e.g., Figs 3a.3 and 3b.4). However, Lg is usually inefficient or blocked through the western Alboran Sea and the Strait of Gibraltar (e.g., Fig 3a.1, 3b.6, and 3c.4). Arrivals to the Rif stations are consistently anomalous (e.g., Fig 3c.2) with no clear arrivals usually visible beyond the first motion. Lg is inefficient through eastern Iberia and blocked for paths crossing the Gulf of Lions and the northern Algerian-Provençal Basin through Corsica and Sardinia. Some efficient paths occur in the western Alboran but the majority are inefficient (e.g., Fig. 3d and Fig 3e). Events from the Tell Atlas and recorded in Spain show complete blockage of Lg (e.g., Fig 3e.2) with only a few exceptions. Lg from these events are efficiently recorded in Morocco after passing through the High Plateau (e.g., Fig 3f.4). Only a limited number of paths sample the High Atlas but these show efficient Lg propagation. Both efficient and inefficient Lg propagation is observed through the Middle Atlas.
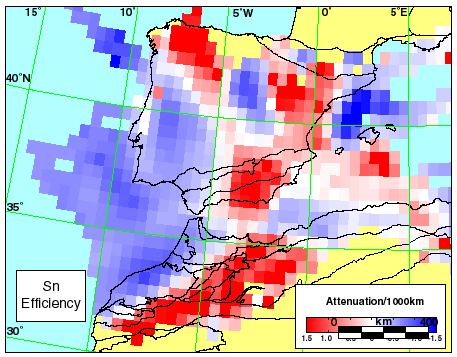
3.2 Sn observations
Sn propagation from earthquakes in the Atlantic and Gulf of Cadiz is very efficient both to the interior of Morocco and Spain (e.g., Figs. 3a.5, 3b.3, 3c.3, and 3c.5). The Sn amplitude is large and extremely high frequency often with significant energy above 10 Hz. Arrivals recorded by stations in the Rif contain large amplitude low frequency (1-2 Hz) energy arriving a few seconds late relative to the expected Sn time. This was also observed by Seber et al. . When band passed at high frequencies, a high frequency arrival coincident with the expected Sn time becomes evident suggesting that the later low frequency arrivals may be converted energy from Sn. Paths crossing the Strait of Gibraltar from events in Africa or Iberia also show strikingly efficient Sn (e.g. Fig. 3b.6). There is an intriguing blockage of Sn from events in NW Iberia recorded in Central Iberia (e.g. Fig 3a. 2). Paths under the Moroccan Meseta and Rif show efficient Sn (e.g., Figs. 3b.4, 3c.3, and 3c.5). Sn propagation is not so efficient in eastern Iberia and becomes less efficient to the southeast. Paths crossing the northern arm of the Algerian-Provençal Basin show almost complete Sn blockage. Sn efficiency across the Alboran Sea is complex, with mainly efficient paths in the west (e.g. Figs. 3d.1, 3d.2, 3d.3, and 3d.5) and a mixture of efficient to blocked paths in the east (e.g., Figs. 3d.4, 3d.6, Fig 3e.4, and 3e.5). More close examination reveals that the blocked paths through the Alboran often include segments beneath the Betics (e.g., Fig. 3d.6; note that a high pass at 2 Hz removes all the amplitude except the P arrival from this waveform) suggesting that the Alboran Sea may allow reasonably efficient propagation and the Betics are highly attenuating. Similarly, Sn is sometimes present in waveforms recorded in Iberia for events from the Tell Atlas. Sn arrivals recorded in inland Spain and crossing the southwestern end of the Valencia trough are low amplitude and emergent, with a maximum frequency content of only about 1-2 Hz (e.g., Fig3e.2) whereas relatively good Sn propagation is recorded by Spanish coastal stations. Sn is not observed for paths that cross the Tell Atlas and High Plateau (e.g., Fig. 3f.6). Given that Sn is observed for paths sub parallel to the Tell from events in the western Alboran (e.g., 3f.5), the attenuation may be either gradual along the long paths beneath the High Plateau or sudden at its western margin. As is the case for Lg, Sn ray coverage is limited beneath the Moroccan Atlas; however, Sn does not appear to propagate efficiently beneath these belts (e.g. Fig. 3f.2).
4 Amplitude Ratio tomographY method
The qualitative method described above although very effective for identifying first order attenuation features is unsatisfactory for two reasons:
Different approaches have been used to quantify the efficiency of Lg propagation. Xie & Nuttli. used a spectral ratio analysis of Lg coda to determine Q values and found their values were similar to those found by direct Q measurement of Lg. Others have calculated Lg Q directly using two stations . A number of Coda Q studies have been conducted in Iberia and will be discussed later. Little work has been conducted on quantifying Sn efficiency. The Lg/Pg ratio provides a good method for mapping Lg propagation efficiency and is the approach used in this study. Although some features may be a result of variation in Pg efficiency, most features will be discussed in terms of Lg attenuation unless we have reason to consider otherwise from our observations of the seismograms. The principle strength of the Lg/Pg ratio method is that given some assumptions one is able to cancel or correct for some troublesome unknowns, such as the station response, source spectra, spreading, and event size. Using the convolution model of Cong, Xie & Mitchell and a slight modification of the derivation of Phillips et al. , the amplitude as a function of frequency for a given phase is given by
aijk(w) = a0i(w)*sjk(w)*cik(w)*xij-bk(w)*exp(-ak(w)*xij)				(1)
where i,j, and k are the event, station, and phase-type indices respectively; a0i is the total amplitude of the source; sjk is the response of the station and site; cik is the partitioning of amplitude into a particular phase-type; xij is the event-station separation; bk is the spreading coefficient and ak is the attenuation factor. Taking ratios of the amplitude of two phases (e.g., Lg and Pg or Sn and Pn) that follow the same path (labeled 1 and 2) at a given frequency and taking the natural log
DAij = DSj + DCi Db*log(xij) Da*xij					(2)
where
DAij = log(aij1/aij2); DSj = log(sj1/sj2) ; DCi = log(ci1/ci2); Db = (b1-b2); Da = (a1-a2).
If we consider xij to consist of a number of line segments of xijm with differential attenuation constants Dam then we may write
DAij = DSj + DCi Db*log(xij) SmDam*xijm					(3)
Given sufficient data, this formulation could be used to conduct a full non-linear inversion for all the unknowns as a function of frequency. However, our data set is not sufficiently dense to allow this. To make the problem tractable, we assume the following:
Assumption (1) allows us to neglect the DS term. It is more difficult to justify assumption (2). Barazangi, Oliver, and Isacks observed that Lg excitation is a function of depth with shallower events more effectively generating Lg. Unfortunately, we lack sufficient observations from single events to explicitly solve for DC for each event. Furthermore, the mechanism for Lg generation and propagation is still not sufficiently understood to allow a correction term to be calculated. We attempt to minimize the effect of event depth by only using earthquakes located at < 35km depth. The error tests discussed below indicate that this assumption is probably reasonable. We may rewrite equation 3 as
![]() 					(4)
					(4)
where we have substituted ![]() Da.
Da. ![]() is
the mean differential attenuation and
is
the mean differential attenuation and ![]() is
the perturbation in differential attenuation along ray segment m. We may solve for the constants DC, Db, and
is
the perturbation in differential attenuation along ray segment m. We may solve for the constants DC, Db, and ![]() by non-linear curve fitting. After application
of these corrections, we rewrite (4) as:
by non-linear curve fitting. After application
of these corrections, we rewrite (4) as:
![]() 				(5)
				(5)
where ![]() is the corrected
log amplitude ratio. A linear tomographic inversion of the corrected amplitude ratios may now be performed to determine
the lateral variations in
is the corrected
log amplitude ratio. A linear tomographic inversion of the corrected amplitude ratios may now be performed to determine
the lateral variations in ![]() . We used a modified
code originally written for Pn velocity tomography by Hearn and Ni . The equations are solved using the LSQR algorithm
. Note that in the implementation of the code a base 10 logarithm was used but this was omitted from the above
derivation for clarity.
. We used a modified
code originally written for Pn velocity tomography by Hearn and Ni . The equations are solved using the LSQR algorithm
. Note that in the implementation of the code a base 10 logarithm was used but this was omitted from the above
derivation for clarity.
The above derivation is valid for a single frequency with all the terms a function of frequency
in equation 5. The values of ![]() were calculated
as follows:
were calculated
as follows:
For increased stability of the amplitude ratios, frequency averages were calculated by determining the mean amplitude over a frequency band. These frequency averages were found comparable to simply taking the ratio of the mean absolute time domain amplitudes in each time window after the application of a 4 pole band pass filter over frequency ranges as large as 1-4 Hz. Given that station and source spectra are not being explicitly cancelled in such a time domain ratio, we conclude that their effects are limited over this band. A similar observation was made by Rodgers et al. using a slightly different form of spectral ratio.
Curve fitting of the variation of the amplitude ratios with distance to determine the correction
parameters for equation 5 indicated that there was a considerable trade-off in this data set between the constants
DC, Db, and ![]() . This trade off means that
the precise values of these individual constants should not be interpreted and only used to correct the observations
. This trade off means that
the precise values of these individual constants should not be interpreted and only used to correct the observations
![]() for effects that could be explained by source
generation, spreading effects, and average attenuation.
for effects that could be explained by source
generation, spreading effects, and average attenuation.
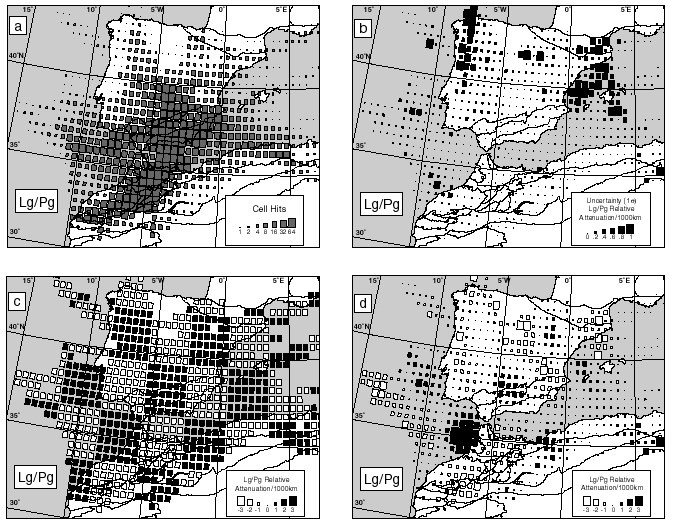
To choose the optimum damping and cell-size for the tomography we conducted a grid search of possible inversion parameters using both the real data and synthetic data. The synthetic data were generated by tracing through a 3° x 3° checkerboard model of alternating high and low attenuating regions and adding Gaussian distributed noise with a standard deviation of 0.2. We also examined the cell hit maps and resulting RMS residuals of the final models. A cell size of 0.5 degrees was found optimum for our data set, allowing a significant cell hit count in our region of interest while still allowing good resolution of small features (Fig. 5). A damping parameter was chosen that provided a 44% improvement to the fit of the data relative to the curve fitted solution. Although lower damping parameters would have allowed an improved fit to the data and also allowed improved recovery of the synthetic checkerboard model, less damping caused the real model to become more unstable in poorly illuminated areas suggesting that we might be only improving the RMS residual by fitting noise. The uncertainty in the derived models was determined by performing bootstrap resampling of the data (Fig. 5b). Bootstrap uncertainty analysis involves repeated inversion (~100 times) of slightly different datasets generated by resampling from the original dataset. The variance in the results obtained provides a measure of their stability. Such an approach is particularly valuable in this study, as we are not able to quantify the noise in the input data. Furthermore, resampling of the data will identify regions where there is a significant variation in the radiation pattern for Lg and Pg from event to event in a region (violating assumption 2 above). Well-illuminated regions contain low bootstrap uncertainties with s less than 0.2/1000 km (Fig. 5b). The Valencia trough contains significant bootstrap uncertainties (~1.0/1000 km) because of its poor ray coverage. An example checkerboard test is shown in Figs. 5c and 5d indicating that we have reasonable resolution in the center of the model with smearing increasing towards the edges, in particular from the Tell Atlas to the Valencia trough.
5 Lg/Pg TOMOGRAPHY RESULTS AND DISCUSSION
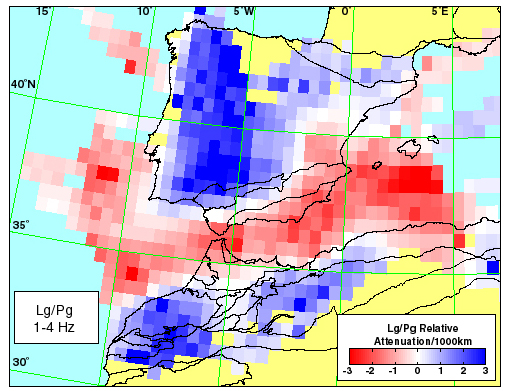
The principle features of the model (Fig. 6) were found fairly insensitive to the inversion parameters and frequency band. The most striking feature is the contrast between the regions of stable continental crust in Iberia and Africa where Lg propagation is efficient relative to Pg and the intervening plate boundary zone and oceanic regions where Lg is attenuated relative to Pg. The Lg-blocking characteristics of the oceanic crust beneath the Atlantic are well imaged with a rapid transition to efficient Lg propagation in the Iberian and Moroccan Mesetas. Lg propagates inefficiently in the Strait of Gibraltar and northern Rif. The crust is believed to be reasonably thick in this region (> 30 km) and does not contain significant sedimentary basins. However, when reporting on a refraction survey collected in the Spanish portion of the Strait, Medialdea et al. noted that the crust is highly attenuating in this region, with even explosions of 2000 kg of TNT not observed beyond 130 km. This observation is supported by the anomalous waveforms recorded by stations in the northwestern Rif and Strait of Gibraltar (e.g., Fig. 3c.2). This region has accommodated significant shortening from the westward transport of the Internal zones. Furthermore, this shortened region was overlain by low velocity flysch eroded from the now collapsed Paleogene mountain belt that may have been thrust to significant depths.
The southeastern Betics are also imaged as a zone of inefficient Lg propagation. The attenuation is still imaged if paths crossing the Mediterranean are removed suggesting that it is not simply smearing from the thin crust known to be located to the south and east. Refraction profiling indicates that the crust underlying the southeastern Betics is relatively thin (~24 km) . Lg attenuation may also be a reflection of the significant deformation of this area, the presence of sedimentary basins or an intrinsically attenuating crust. The Alboran Sea is also imaged as a poor Lg propagation zone in agreement with previous proposals that the continental crust beneath the Alboran is thin (15-20 km) . The thick (~7km) sediments under the western Alboran Sea probably also play a role in the Lg attenuation. Lg appears to become increasingly inefficient from the central Alboran Sea to the Algerian-Provençal basin as would be expected from the continued crustal thinning to the east .
Efficient Lg propagation is imaged through the High Plateau of Algeria. The Middle Atlas appears as a zone of inefficient Lg propagation separating the relatively undeformed Moroccan Meseta and High Plateau blocks. There is a marked west to east decrease in Lg efficiency in Iberia. The Hercynian Massif or Iberia Meseta (Fig. 1) has been a regional high since at least the Carboniferous (300 Ma) and has only very limited sedimentary cover. In contrast, eastern Iberia exhibits significant crustal deformation in the Iberian chains and contains a number of significant basins. Although, the Valencia trough is imaged as a region of poor Lg propagation, as would be expected for a zone of extended continental crust, it should be noted that the bootstrap analysis indicates that this portion of the model is unstable owing to the limited ray coverage and should not be interpreted.
A number of studies have been conducted of the regional Coda-Q structure of Iberia ). Although measuring different features of the waveform, the study conducted by Pujades et al. shows some distinct similarities and differences compared to our results. Both studies identify a region of particularly low efficiency in the southeast Betics. This region was also identified by Canas et al.. A significant difference is the increased southerly extent of efficient Lg propagation in region in our model for western Iberia. This may be a reflection of improved ray coverage in the south or differences in the ray paths taken by coda energy versus more direct paths. Given that the Iberian Massif does have a significant north-south extent and that the southern portion of the Iberian Massif is well illuminated in our study, we believe that this portion of Iberia is a region of efficient Lg propagation.
6 Sn PROPAGATION EFFICIENCY TOMOGRAPHY
A similar ratio approach to above was initially investigated for determining the efficiency of Sn propagation. Our depth cut-off was extended to 60 km as we need no longer be concerned with efficiency of coupling energy into the crust. The major features imaged were not affected by the choice of a cut-off depth. We tried ratios of Sn amplitude to other phases such as Pn, Pg, and "all P" energy (from first motion to Sn). Although Pn is the only phase that follows a similar path to Sn and hence the only phase for which the ratio method strictly applies, Pg and "all P" were investigated as alternatives for normalizing the Sn amplitudes owing to the unsatisfactory results obtained for Sn/Pn. It was not possible to find a good section of the waveform against which to ratio the Sn amplitude that resulted in a model that could reconciled with our qualitative observations. Using a theoretical approach, Kennett noted that Sn/Pn amplitude ratios are likely to be sensitive to source radiation patterns whereas an Lg amplitude ratio is probably more sensitive to path effects. This example illustrates the limitations of a ratio method and the need for careful checking with qualitative observations. An alternative method was investigated using the qualitative observations shown in Fig. 4b to invert for a map of Sn efficiencies. This method may be viewed as a modification of the ratio method. Consider equation (4) but now phase 1 is the observed Sn amplitude and phase 2 is the Sn amplitude that would be observed if there was a constant attenuation factor of a2 along the path so the DSj, DCi and Db terms cancel:
DAij =log(aij1/aij2) = Sm(a2-a1m)*xijm = Smam*xijm.				(6)
In categorizing the phases into qualitative bins the observer is essentially attempting to correct for the DSj, DCi, and Db terms. These categories may be considered to correspond to discrete values of DAij. We assume that a2 corresponds to the attenuation factor for an efficient path, so DA is set to zero for efficient observations (as log(1) = 0). We further assume an arbitrary log amplitude ratio for a blocked path of DAijobsblock and a variable value k*DAijobsblock (where k is between 0 and 1) for a "present" path. The anomalous "unclear" observations are assigned a value of (k+1)/2 but choice of this parameter has negligible impact on the results owing to their small number. The value of a derived model parameter am is dependent on the choice of DAijobsblock. However, we may normalize the model parameter by dividing by DAijobsblock resulting in:
a mnorm = (am)/(DAijobsblock)							(7)
Figures 7,8,9 were obtained by subtracting the mean value of the model parameters to show the perturbations relative to the mean attenuation. There is not a one-to-one relationship between the true distance over which Sn will be blocked and a mnorm owing to the discrete nature of the input dataset. However, synthetic tests indicate that this approach does appear to be effective at differentiating regions of efficient and inefficient Sn propagation and assigning interpretable relative values to the anomalies (e.g., Fig 7c and Fig. 7d).
We performed a search of different values of the cell size, k and the damping parameter to obtain an idea of the areas of the model that were sensitive to these parameters. We chose a cell size of 0.5 degrees. Fig. 8 shows an example of 4 different combinations of k and the damping parameter illustrating the possible variations in the final model. As would be expected, the areas most sensitive to k are those predominantly illuminated by "present". The region between Algeria and eastern Spain in particular shows significant changes for different choices of k. Given that this region contains Sn phases that are sometimes barely visible we chose a value of k=0.5 corresponding to 70% amplitude attenuation relative to efficient propagation, resulting in this region being imaged as slightly attenuating. Figs. 9, 7a, and 7b, respectively, show the preferred model, hit map, and 1 s bootstrap uncertainties that result from a damping of 0.4 and k = 0.5. Synthetic spike and checkerboard resolution tests were conducted following the method of Sandvol et al. . Attenuating zones in the shape of a checkerboard or more diffuse spikes (Fig. 7) were assigned a blockage length. If upon ray tracing, a ray was found to spend longer than this blockage length in attenuating regions then it was assigned an inefficient/blocked value. If it spent between k/2 and (k+1)/2 of the blockage length in attenuating zones (where k was chosen to be 0.5), it was considered "present", otherwise it was considered efficient. After the assignments, 30% of the synthetic observations were swapped with neighboring categories to simulate the effect of misclassification or complications resulting from source generation effects. The degree of recovery is dependent on the choice of the blockage length and separation of attenuating regions. The central portion of the model (Fig. 9) is well illuminated with low uncertainties and fairly good resolution. Low illumination results in significant uncertainties in the Valencia trough and northernmost Iberia regions. The Atlas and High Plateau regions are also poorly illuminated but contain lower bootstrap uncertainties owing to the consistency of observations.
The most significant and robust efficient zones are located in the Atlantic, Gulf of Cadiz, western Rif, Moroccan Meseta, and south Iberian Meseta (Fig. 9). Although these features in the western portions of Iberia and Morocco probably do reflect some smearing from very efficient ocean paths there are also very strong Sn arrivals in this region for paths that are entirely continental (see Fig. 3). The most robust inefficient zones are located in the central Betics and northern Alboran Sea and the High Plateau and Moroccan Atlas. The western boundary of the inefficient zone in the Betics is fairly well constrained to the Malaga region, whereas the eastern boundary and NE boundary is not so well constrained. Most of the Alboran is imaged as relatively efficient, the central Alboran is of intermediate efficiency, and is difficult to constrain as most paths passing through the Alboran are also passing through the attenuating Betics. A region of relatively efficient Sn is imaged in the easternmost Alboran with a decrease in efficiency to the east in the Algerian-Provençal Basin. The inefficient zone in NW Iberia is imaged but its precise location is unconstrained because of the limited ray coverage. The significant attenuating zone in NE Iberia is also constrained by few rays. Many of these rays also pass through other attenuating zones to the south, so despite the size of the anomaly in this region, it probably should be interpreted with caution.
7 CONSTRAINTS ON DEPTH EXTENT OF Sn ATTENUATING REGIONS
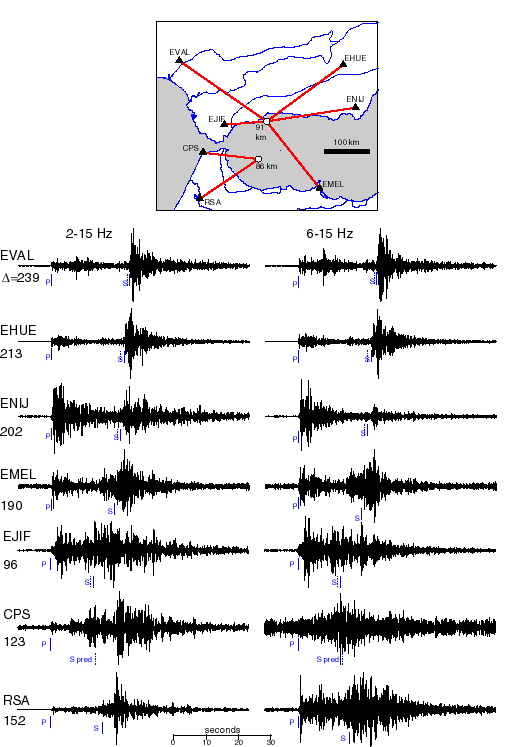
In an attempt to assess the vertical extent of the attenuating zones, we examined waveforms recorded from events located at intermediate depths. Initially it seemed that all paths from subcrustal events recorded at distances greater than 150 km allowed efficient Sn propagation. However, when higher frequencies (> 6 Hz) were examined, a pattern emerged. Paths from the intermediate depth earthquakes along the southern coast of Iberia to station ENIJ in the Betics consistently show more relative attenuation of S relative to P when compared to other stations located at similar distances (Fig. 10). Even EMEL located on the opposite side of the Alboran Sea apparently receives more high frequency S wave energy through the mantle than ENIJ. Although the paths to ENIJ do appear to be more attenuating than other upper mantle paths, the fact that a greater than 6 Hz signal is still received by station ENIJ does suggest that shear wave energy still followed a path of reasonably high average Q in contrast to those paths from crustal events that perhaps are sampling shallower levels. It should also be noted that ENIJ records significantly fewer arrivals than other Iberian stations, although this may also be caused by crustal scattering and attenuation.
In contrast, waveforms recorded by closer stations in the Strait of Gibraltar do not show distinct S arrivals (Fig. 10) and are considerably more complicated. S arrivals from intermediate depth earthquakes will be inherently more difficult to see on vertical component seismometers at shorter distances. However, the dominance of low frequencies and complex nature of the waveforms when compared to recordings of the same events in other regions at similar distances suggests that a highly attenuating zone exists along these paths. Evidence discussed previously suggests that the Gibraltar crust is certainly attenuating. It is also possible that the upper mantle is attenuating in this region. However, an attenuating region in the upper mantle would have to be of limited vertical extent given the efficient propagation of Sn along horizontal ray paths under the Strait of Gibraltar and the western Alboran.
To obtain some idea of the 3-dimensional distribution of attenuating regions, we traced all the rays used in the attenuation study through a 3-D S velocity model and examined the ray paths for any depth dependence of attenuation. By doing this we are essentially assuming that longer Sn ray paths or those from sub crustal events will be more sensitive to deeper levels of the mantle than shorter ray paths or those from crustal events. As the majority of the ray paths used in this study are reasonably short these assumptions may be valid as the Sn has not traveled a sufficient distance to become a true guided wave. Although errors in the location, velocity model, and ray tracing will probably result in ray segments appearing at incorrect depths, some interesting observations can be made. The principle observation is that the eastern Betics appear to attenuate Sn to a depth of approximately 60 km. However, paths from intermediate depth earthquakes passing below this region appear to propagate relatively efficiently. The western Betics, Rif and western Alboran are identified as efficient between depths of 45-60 km. The western Betics also appear efficient at depths of 30-45 km. There is a marked absence of illumination in the 30-45 km layer beneath the western Rif and westernmost Alboran suggesting that we may have less sensitivity to shallower attenuation in these areas. The depth dependence of attenuation in the eastern Alboran is also unclear because of the sparse ray coverage and the intersection of rays with other attenuating regions.
8 Pn VELOCITY TOMOGRAPHY
The same variations in mantle rheology that affect the efficiency of Sn propagation also influence the propagation velocities of Pn and Sn phases. Inversion of Pn travel times for velocity structure provides an additional valuable insight into the structure of the upper mantle beneath the Alboran Sea region.
8.1 Pn data
The two Pn travel time datasets are a combination of picks made by the authors from digital and analog waveforms and available catalogs from Morocco, USGS, and ISC that span the period 1964-1998. Details of the synthesis of the different data sets and relocation of earthquakes are reported in Calvert et al. . The first (1DLOC) consists of locations determined using a simple 1-D velocity model with no station corrections, the other (3DLOC) consists of relocations in a 3-D model determined using velocity tomography with associated station corrections . We decided to use the two datasets to check that anomalies are not imaged as a result of biases introduced by possible tradeoffs that might occur when using the 3-D model for earthquake locations. Only earthquakes with locations satisfying the following criteria were extracted: location determined using 8 or more stations; condition number < 150; weighted RMS residual < 2 seconds, nearest station used for location within 150 km; azimuth gap in station coverage < 200 degrees; formal location error < 5 km. The remaining arrivals were further winnowed by only selecting those with ray lengths between 1.7 and 11 degrees and a location residual of less than 8 seconds. After removal of the crustal contribution to the travel time (assuming a 33 km thick crust with an average velocity of 6.2 km/s and a mantle velocity of 8 km/s), the phases were iteratively selected so that the inversion used only events and stations recording over 5 arrivals with residuals of less than 4 seconds relative to a least squares straight line fit to the travel times. The choice of average crustal thickness and velocity have a negligible effect on the final Pn velocity solution as any constant offset in the travel times owing to an incorrect choice of the crustal parameters is absorbed by the intercept component of the line fit. The final 1DLOC and 3DLOCdatasets consists of approximately 430 and 530 events and 6,200 and 7,600 phases, respectively (Fig. 11a). More phases are included in the 3DLOC dataset as the 3-D relocation enabled more data to satisfy the winnowing criteria. An average upper mantle P velocity of 8.1 km/s was obtained for both datasets.
8.2 Pn method and results
Inversion of the Pn travel time residuals was performed using a code developed by Hearn that solves for isotropic and anisotropic (in 2-dimensions) components of the mantle velocity structure. Two separate damping coefficients are used for the slowness and anisotropy components. Strong tradeoff exists between these components so the degree to which the data are fit by isotropic and anisotropic structure is determined by the ratio of the damping coefficients. A grid search of the damping parameters using both synthetic and real data was performed to choose the damping parameters. We found that damping parameters of 500 for both the slowness and anisotropy with a cell size of 0.25 by 0.25 degrees provided significant number of hits in each cell (Fig. 11b) while providing a good balance between uncertainty and resolution. No objective reason could be found to use unequal damping for the anisotropy and velocity components. Different damping parameters only changed the relative amplitude of imaged anisotropy and velocity anomalies without significantly changing the first order features or the fit to the data. We obtain a measure of the resolution of the velocity and anisotropy components by using the same damping parameters to invert synthetic arrival times generated using checkerboards of alternating high and low velocities and/or anisotropy orientations. Gaussian noise with a standard deviation of 1 second was added to simulate picking errors, although we believe that the majority of the Pn picking errors are probably less than 0.5 seconds . Figs. 12a and b show recovery of a 2° checkerboard model that includes alternating low velocity with an east-west oriented anisotropic fast direction and high velocity with a north-south fast direction squares. The RMS misfit to the data is 0.96 seconds suggesting that the inversion parameters chosen do not result in excess fitting of noise. In southern Iberia, the Alboran Sea, and northern Morocco checkerboards of even 1° may sometimes be recovered. The orientation of anisotropy is a more difficult parameter to resolve owing to a trade off with predominant ray direction in a region. For example, a fast region containing no anisotropy but illuminated by predominantly E-W rays will be imaged with a lower amplitude velocity anomaly and some anisotropy with an E-W oriented fast direction. Inversion of synthetics generated from models containing only homogeneous high velocities or north-south oriented anisotropy indicate that the majority of the model is sufficiently illuminated by rays of differing orientation to prevent such biasing. However, inversion of synthetics from a model containing only high velocities images some limited anisotropy along the model boundaries with fast directions sub parallel to the edges. Bootstrap velocity uncertainties are usually less than 0.05 km/s in the well-illuminated portions of the model (Fig. 12c) and anisotropy errors are below 0.04 km/s (Fig. 12d). The poorly illuminated region at the intersection of the Middle and Tell Atlas and the Rif contains the most significant uncertainties.
The station delays (Fig. 13) result from deviations from the average crustal thickness or crustal velocities and are the most robust portion of the inversion with little sensitivity to the inversion parameters. For a 6.2 km/s mean crustal velocity and a 33 km thickness, a station delay of 1 second corresponds to a 9.8 km change in crustal thickness or a 0.7 km/s change in mean crustal velocity. The true reference crustal thickness and velocity will be different from those discussed earlier in the Pn data section because of the line fit step in the data preprocessing but they are unlikely to be far from these values. The large station delays show a consistent geographic distribution. The largest positive delays are located in the Strait of Gibraltar and sometimes reach more than 1.5 seconds. Such significant delays, if caused by increased crustal thickness alone, would suggest a crustal thickness in excess of 45 km assuming a reference crustal thickness close to 30 km. Although no direct measurements have been made in this region, such a thickness is very unlikely. Explaining this anomaly solely by a slow crustal velocity results in a mean crustal velocity of 5.2 km/s, which is also probably unreasonable. A more reasonable combination of a 5 km thicker than average crust and a decrease in the mean crustal velocity of 0.5 km/s would produce approximately a 1.4 sec delay. As mentioned previously, the crust in the Strait of Gibraltar region is heavily deformed from the westward transport of the Internal zones, and may contain relatively low velocity upper crustal rocks and sediments thrust to significant depths. Low crustal velocities, coupled with limited crustal thickening and perhaps even absorption of some signal from a low velocity uppermost mantle may all be contributing to these delays.
Figure 14 shows the velocity images determined for 3DLOC and 1DLOC with and without inverting for anisotropy components. Many features are present in both the 1DLOC and 3DLOC models. The most significant velocity feature is the very strong low Pn velocity anomaly located beneath the Central Betics. This anomaly, with an average Pn velocity of about 7.7 km/s, is very stable whatever inversion parameters are chosen. The strongest amplitudes of this anomaly are located in the middle of the central Internal Betics. The northerly extent of this anomaly is considerably greater in the models including anisotropy. Its southern border is well constrained to just south of the Alboran coast. Inversions that exclude anisotropy allow the anomaly to extend to the southeast across the Alboran Sea but the bootstrap uncertainties indicate that this portion of the model is relatively poorly constrained so this feature may be a result of smearing of this very strong anomaly. The western boundary of the Betic anomaly occurs in a well illuminated portion of the model and appears to be bound by the Iberian coast until 5° W. A number of refraction studies have been conducted in the Betics . These studies identified a very thin mantle lid (~ 6km) with a velocity of 8.1 km/s reaching a depth of approximately 38-40 km underlain by a low velocity region of 7.8 km/s to a depth of 60 km where velocities again reach 8.3 km/s. Given the width of the low velocity zone and the lengths of our ray paths we are probably most sensitive to this low velocity zone. Banda & Ansorge also note that large explosions located in the Gulf of Cadiz could not be recorded more than 130 km east of the shot point. Although this may be caused by the highly attenuating crust in that region, it may also reflect the presence of an attenuating upper mantle beneath the western Betics. Low upper mantle velocities beneath the Betics have also been found by 3-dimensional tomography studies .
Lesser but relatively consistent low velocity anomalies are also located in the eastern Rif, Middle Atlas, and the Missour Basin (Fig. 1). The 1DLOC and 3DLOC models differ in the northerly extent of this anomaly with the 3DLOC model extending it beneath the Internal Rif and possibly northwards just to the east of the Strait of Gibraltar to join with the Betic anomaly. Refraction profiles across the Middle and High Atlas identify the upper mantle beneath these belts as being fairly low velocity (7.7 7.9 km/s). Poor signal quality prevented Hatzfeld & Bensari from inverting refraction profiles collected in the Rif region.
The eastern Alboran and western Tell show results that are less consistent, being imaged as anything from slightly elevated to low Pn velocities. This region also contains some of the highest bootstrap uncertainties and probably contains relatively poor event locations because of sparse station coverage, so we are not able to make any firm statements about the upper mantle velocity structure beneath this area. The Moroccan Meseta and Gulf of Cadiz are imaged as regions of fast Pn, with velocities of 8.2-8.3 km/s.
The central Alboran Sea is imaged as a region of average or slightly elevated velocity relative to a velocity of 8.1 km/s. This is surprising considering the results of an east-west oriented refraction profile conducted through the center of the Alboran Sea that found anomalously slow upper mantle velocities of 7.5 km/s. In contrast, north-south oriented profiles located at the west and east ends of this line found mantle velocities of 8.4 km/s and 7.9 km/s, respectively. Other tomography studies have also found elevated or relatively normal upper mantle velocities beneath the Alboran . The absence of stations and significant seismicity in the Alboran Sea region, coupled with significant variations in crustal thickness and velocities makes this area difficult to constrain. Synthetic tests conducted by Calvert et al. (2000) indicated that although crustal thickness variations may play a role in generating this anomaly they are unlikely to be solely responsible. Examination of the imaged anisotropy (Fig. 14d) provides an additional means for reconciling these results. Significant anisotropy (+/- 0.2-0.3 km/s) is imaged in the area of the profiles with a predominantly N-S oriented fast axis. Although unable to account completely for the extreme values found, an average upper mantle velocity of 7.9 8.1 km/s coupled with this level of anisotropy might allow for a variation of 7.7 to 8.3 km/s depending on the orientation of the profile.
Independent observations of anisotropy in the region are provided by the SKS shear wave splitting results of Díaz et al. (Fig. 14d). There is a strong correlation between results in the central and western Betics and southernmost Iberia where we have the most control. The imaged fast axes have a predominant E-W trend in the Betics that becomes more northeast-southwest in the western Internal zones before trending almost N-S beneath the Strait of Gibraltar. The fast directions do not agree in the southeastern Betics. Whether this is a result of anisotropy below the resolution of our data, biasing owing to ray orientation, or simply an indication of variation of anisotropy with depth is not clear. Although there are only limited differences between the results of 1DLOC and 3DLOC inversion, we favor the 3DLOC model as it allows more of the data to pass through the winnowing criteria while still maintaining an improved RMS fit of 0.84 sec relative to 0.87 sec for the 1DLOC model.
9 Synthesis of results and implications for lithospheric structure
The consistent observations of low crustal velocities and strong crustal attenuation in the western Rif and Betics suggest that probably the entire crustal column was heavily deformed by the westerly transport of the Internal zones during the Miocene. It is also possible that this crustal attenuation results from the presence of a hot, and possibly partially melted uppermost mantle. However, as the crust is so attenuating, it is difficult to make clear observations about the attenuation structure of uppermost mantle beneath the Strait of Gibraltar. Arrivals from intermediate depth earthquakes do appear heavily attenuated, and examination of analog waveforms recorded in the Rif provide some indication of Sn attenuation for short paths in support of anomalous upper mantle. However, the anomalous nature of the crust underlying these stations render these observations ambiguous. Longer ray paths, perhaps sampling deeper lithospheric levels, pass efficiently beneath this region, suggesting that any anomalous attenuating uppermost mantle may have a limited depth extent. The relative inconsistency of an imaged Pn low velocity region beneath the Strait of Gibraltar would also support its limited size. Calvert et al. imaged low uppermost mantle velocities beneath the Strait but only in the shallowest 30-45 km layer.
The most robust and consistent observation of the Sn efficiency and Pn velocity studies is that the mantle beneath the Internal and possibly the southern External Betics is low velocity (7.6-7.8 km/s) and extremely attenuating (Fig. 15). It is likely that the uppermost mantle in this region contains some level of partial melt. Furthermore, Carbonell et al. and Pous reported a correlation between a high conductivity zone in the upper mantle imaged by a magnetotelluric study and the low velocity region, favoring the presence of melt near the base of the crust. The mechanisms for initiating this melting could be either by heating or decompression melting owing to asthenospheric upwelling or by the addition of water to the system from possible subducting continental crust. This melting would probably have to be limited, as there has been no volcanism in the central Betics since the intrusion of basaltic dikes in the earliest Miocene. Younger volcanism is found in the easternmost Betics but this is believed to have terminated in the latest Miocene . There has been a period of Late Miocene and Pliocene uplift of the Internal Betics that may be related to the thrusting of the Internal zones onto Iberia, shortening of the Internal Betics at depth or heating and thinning of the underlying mantle lithosphere . Shear waves from the intermediate depth earthquakes located beneath the western Alboran are able to propagate very efficiently under this attenuating zone, further suggesting that it has a limited depth extent. Tomography studies also restrict this region to depths between 30-60 km beneath the majority of the Internal Betics with a thickening from north to south .
In sharp contrast, most of the Alboran Sea appears to be underlain by relatively fast (8.0-8.1 km/s) upper mantle that allows efficient propagation of Sn. Despite concerns that this may be partially an artifact caused by the rapid change in crust thickness at the borders of the Alboran, the additional observation of efficient Sn propagation in the Alboran Sea suggests that the mantle lithosphere may be relatively cold and of sufficient thickness to allow efficient Sn propagation. The Alboran seafloor consists of continental crust rapidly thinned during the early Miocene and is dotted with Miocene volcanic rocks . The observations of extensive volcanism and constraints from thermobarometry suggest that significant heating occurred near the base of the Alboran crust in the early Miocene in conjunction with rapid thinning by extension. Thermal modeling of the P-T-t paths followed by rocks exhumed by this extension lead Platt et al. to suggest that the lithosphere was almost completely removed during the earliest Miocene, allowing asthenospheric material to reach close to the base of the crust. The youngest volcanic rocks recovered from the Alboran Sea region are of Latest Miocene age . To observe efficient Sn propagation at present beneath the Alboran Sea either the mantle lithosphere must have thermally recovered to a significant thickness since Miocene times or the crustal heating, extension, and volcanism occurred without removing all the mantle lithosphere. Chinn, Isacks, & Barazangi suggested that a thin mantle lid may impose a cut-off distance beyond which Sn will not propagate. All rays that travel wholly beneath the thinned crust of the Alboran and Algerian-Proven¸ al basin contain a clear Sn arrival. The longest ray path is only 8 degrees so it is possible that Sn is propagating efficiently in a fairly thin lid. Polyak et al. on the basis of heat flow data and gravity modeling proposed an eastward thinning of the mantle lid from about 75-35 km in the west Alboran basin to only 30 km in the east Alboran basin. Assuming that thermal recovery of the mantle lid began at the cessation of volcanism 6 Ma and that we may treat this recovery in the same manner as thermal thickening of young oceanic lithosphere , we obtain a predicted mantle lid thickness of 30 km. Unless, the overlying crust has a particularly low thermal conductivity this is probably a lower bound for the mantle lid thickness beneath the Alboran Sea.
The Gulf of Cadiz, the Strait of Gibraltar region, western Iberia, and the Moroccan Meseta all appear to be regions of high Pn velocity and very efficient Sn propagation. There are hints of lower Pn velocities off the southwestern tip of Iberia near the intermediate depth seismicity but they are not well resolved and may be related to poor event locations and limited coverage.
Pn velocities beneath the Eastern Rif and Middle and High Atlas appear to be relatively slow. The Atlas system is also imaged as a region of attenuating uppermost mantle. This observation is puzzling as rifting and associated lithospheric thinning ceased in the Mesozoic. However, scattered Quaternary alkali basaltic magmatism is present in the Guercif Basin and Middle Atlas , indicating the mantle lid may still not be particularly thick or contains an element of melt. The uppermost mantle of the eastern Rif is not imaged as attenuating. This may be related to relatively poor sampling of the upper mantle beneath this region by our waveform dataset except by a large number of paths travelling through the efficient Moroccan Meseta. The High Plateau is imaged as having only slightly lower than average Pn velocity. Sn appears to be blocked along paths through this region, but because of the length of these paths, it is not imaged as particularly attenuating by the inversion. The absence of stations and events in the High Plateau do not allow us to uniquely determine whether attenuation is occurring gradually under the entire High Plateau or more suddenly in the Middle Atlas and Missour Basin region. A hotter uppermost mantle might provide an explanation for the high elevation (1000-1500 m) of this long wavelength feature. The westernmost Tell Atlas is imaged as either low or average Pn velocity depending on the damping level of the anisotropy component. Two paths from the Alboran Sea show efficient Sn propagation through this region, however, the sparse station coverage renders this region ambiguous both in terms of velocity and attenuation structure. The western end of the Algerian-Proven¸ al Basin is imaged with relatively low Pn velocities. Paths crossing this zone and recorded in inland Spain exhibit an attenuated Sn arrival. However, these rays may be crossing attenuating regions just inland from the coast, as efficient Sn is observed at coastal stations implying a presence of some mantle lid in the westernmost Algerian-Proven¸ al Basin.
The various geodynamic models that have been proposed for the Alboran region make different predictions of the present day uppermost mantle structure. Convective removal and slab break-off models propose that continental or oceanic lithosphere detached completely during the earliest Miocene and probably sank into the mantle with hot asthenospheric material upwelling to replace the descending body. A significant gap might be expected today between the detached lithosphere and the base of the crust. A retreating subduction model or delamination model implies that a more limited volume of asthenospheric material intruded to the base of the crust above colder lithosphere that remains attached to the surface. This asthenospheric wedge might also be expected to progressively thin up the dip of the descending or delaminated slab. Melt associated with a process that terminated in the Miocene is unlikely to be present today. Even neglecting the presence of the underlying cooling lithospheric body, the simple analogy with thickening of oceanic lithosphere discussed above would suggest that such an asthenospheric wedge beneath the Betics would cool within a few million years unless affected either by a new mechanism or by the same mechanism that caused the original Miocene deformation. If still active today, the absence of substantial recent volcanism would suggest that the original mechanism would have to be proceeding in a more modest form than when it was first initiated during earliest Miocene. Slab break off and convective removal models do not predict the continued presence of hot attenuating mantle at shallow depths underlain by faster less attenuating mantle as observed beneath the Betics. Platt et al. explicitly state that their thermal modeling of the P-T paths followed by rocks exhumed during the Miocene extension of the Internal zones cannot be explained by placing them in a back-arc setting overlying a retreating subduction zone. Assuming that the present mantle structure is related to these Miocene processes, the shape of the attenuating and low velocity regions and the apparent efficiency and higher velocity of paths that sample the mantle beneath them, coupled with the observations of Platt et al. lead us to prefer a delamination model involving peeling back of continental mantle lithosphere as a model rather than retreating subduction. Seber et al. also proposed this mechanism for the Rif in addition to the Betics. The limitations of the data used for this study do not allow the possibility of delamination beneath the Rif to be either supported or refuted.
It is possible that a new process is active today beneath the Betics. The most attractive model is one involving subduction of the Iberian crust under the Internal Betics owing to the continued convergence of Africa and Iberia . The subduction of buoyant continental crust is difficult and is usually proposed in regions of rapid continental collision such as the Hindu Kush . The absence of significant crustal thickness beneath the Betics or evidence of significant recent shortening of the Internal zones would require that the subducting Iberian lithopshere be flexed downward either by dense oceanic lithosphere or delaminated continental lithosphere. The absence of any evidence for significant southward subduction of the former in the Alboran region would argue for delaminated lithosphere.
10 Conclusions
Regions of Lg attenuation correlate well with areas of thinned continental or oceanic crust or significant sedimentary basins except in the Strait of Gibraltar region where attenuation is believed to be related to the intense deformation of the region from crustal scale thrusting and shortening and possibly a hot uppermost mantle. The Iberian and Moroccan Mesetas and the High Plateau are imaged as regions of particular efficient Lg propagation probably owing to their significant thickness and the absence of basins. A robust low Pn velocity (7.6 7.8 km/s) anomaly is imaged beneath the Internal Betics and may extend beneath the External Betics. This low velocity anomaly correlates very well with a zone of Sn attenuation. Together with other studies, these observations represent strong evidence for the existence of partial melt at the base of the Betic crust. There is a sharp transition near the southern Iberian coast to normal (8.0 - 8.1 km/s) mantle velocities beneath the Alboran Sea, which also correlates with efficient Sn propagation. Low Pn velocities are imaged beneath the Rif region. Low Pn velocities are also imaged along the Moroccan Middle Atlas system, again correlating with a region of Sn attenuation. The Strait of Gibraltar, Moroccan and Iberian Mesetas, Gulf of Cadiz region, and western Atlantic are imaged as regions of very efficient Sn propagation with average Pn velocities of 8.1-8.3 km/s.
These observations when combined with those from previous studies support a delamination model to explain the evolution of the Alboran Sea region since the Neogene. The precise classification of the upper mantle process presently active beneath the Betics as delamination, rather than a limited form of continental subduction, perhaps aided by previously delaminated lithosphere, remains ambiguous.
Acknowledgments
This work was supported by National Science Foundation Grant EAR-9627855. The authors would like to thank IGN, IAG, CNR, IRIS, and GEOFON for providing the waveform data used for the study. The first author would like to particularly thank the staff of CNR, IAG, and IGN for their hospitality during his visits. Paco Gomez contributed to this paper during numerous discussions and his helpful review. We also thank Arthur Rodgers for comments and suggestions. Institute for the Study of the Continents contribution number 260.
References
Table 1. Relationship between assigned efficiency and observed Lg and Sn efficiencies.
|
Assigned Efficiency # |
Lg |
Sn |
|
1 |
Efficient | Efficient |
|
2 |
Inefficient | Present |
|
3 |
Very inefficient or blocked | Blocked |
|
4 |
Not clear | Not clear |
|
5 |
Ignore, too noisy | Ignore, too noisy or too short |
Figure Captions
Figure 1. Map showing the principal tectonic features of the western Mediterranean. B: Balearic Islands; C: Corsica; G: Gibraltar; GB: Guercif Basin; GC: Gulf of Cadiz; GL: Gulf of Lions; HM: Hercynian Massif or Iberian Meseta; IC: Iberian Chain; M: Malaga; MB: Missour Basin; MM: Moroccan Meseta; MA: Middle Atlas; S: Sardinia; SA = Saharan Atlas. Note: The Paleogene and Neogene thrust belts in the Betics and Rif correspond to the Internal and External zones, respectively.
Figure 2. Map showing location and type of stations used for this study. Broadband station names are labeled.
Figure 3. Representative examples of waveforms in the region and classified efficiencies. Stations are marked by black triangles. Events are marked with an open circle. All waveforms are band passed from 0.5 to 6 Hz using a 4-pole 2-pass Butterworth filter. Waveforms are labeled with the station name, event depth (d), path length (D ), observed Lg propagation efficiency (Lg) and Sn propagation efficiency (Sn), and log2(Lg amplitude/Pg amplitude) (Lg/Pg). See Table 1 for classifications of efficiencies. Picked P and S arrivals are shown with a solid line. The predicted S arrival time relative to the first motion assuming a crustal thickness of 30 km, a crustal S velocity of 3.6 km/s and a mantle S velocity of 4.6 km/s is marked by a dotted line. Pg window is 6.2 5.2 km/s and Lg window is 3.6-3.0 km/s.
Figure 4. Qualitative Lg and Sn efficiencies
Figure 5. Hit map, bootstrap uncertainties and synthetic checkerboard test for Lg/Pg ratio tomography for 1-4 Hz.
Figure 6. Lg/Pg ratio tomography results for the 1-4 Hz frequency band. Compare the results with Fig. 1 to observe the good correlation between tectonic features and the imaged Lg/Pg differential attenuation. Regions of thin or significantly deformed crust and sedimentary basins appear to result in increased attenuation of Lg relative to Pg.
Figure 7. Hit map, bootstrap uncertainties and synthetic checkerboard test for Sn efficiency tomography.
Figure 8. Effect of different damping parameters and the value of k (varies between 0 and 1, where 0 represents efficient Sn propagation and 1 blockage of Sn) assigned to the "present" Sn efficiency category. Note that increasing k, corresponding to considering "present" as more attenuating, increases the amplitude of the Betic and Atlas anomalies. Lowering the Laplacian damping also increases the size of the anomalies.
Figure 9. Sn efficiency tomography results and chosen inversion parameters. The most pronounced and best-controlled attenuating region is the eastern Betics. Significant anomalies are also imaged beneath the High Plateau and Atlas system. The Atlantic, Gulf of Cadiz, and Moroccan and southern Iberian Mesetas are imaged as efficient.
Figure 10. Examples of waveforms showing efficient propagation from intermediate depth earthquakes. Application of a 6-15 Hz band pass shows increased relative attenuation of shear waves compared to P waves to station ENIJ under the attenuating zone in the Betics. Note the complexity of the waveforms and their low frequency content.
Figure 11. (a) Rays paths and (b) cell hit map used for Pn travel time tomography (3DLOC dataset).
Figure 12. Synthetic checkerboard and bootstrap errors for velocity and anisotropy components of Pn tomography for 3DLOC dataset.
Figure 13. Map showing station delays based on Pn tomography. Note the significant delays found in the Strait of Gibraltar region that probably result from low velocity slightly thickened crust in this region.
Figure 14. Pn velocities and anisotropy results.
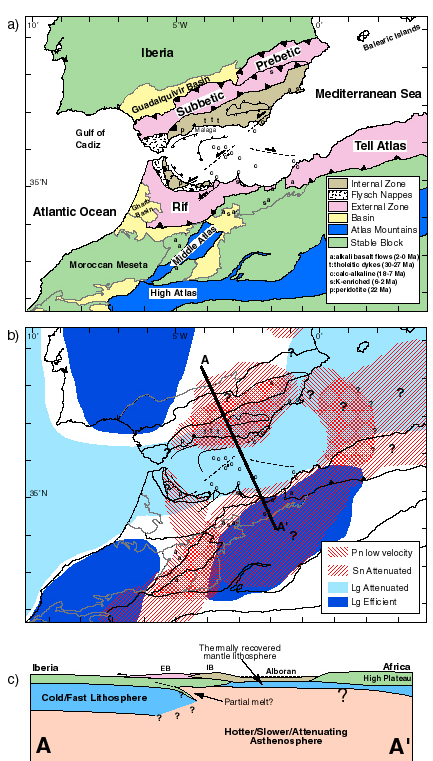
Figure 15. Summary figure showing: (a) tectonic map and approximate dates of volcanism , (b) summary of attenuation and velocity results superimposed on tectonic boundaries and Neogene volcanism, and (c) cartoon cross section showing proposed present lithospheric structure beneath the Betics and Alboran Sea. EB:External Betics and IB:Internal Betics. Patterns are the same as those used in Fig 15a.