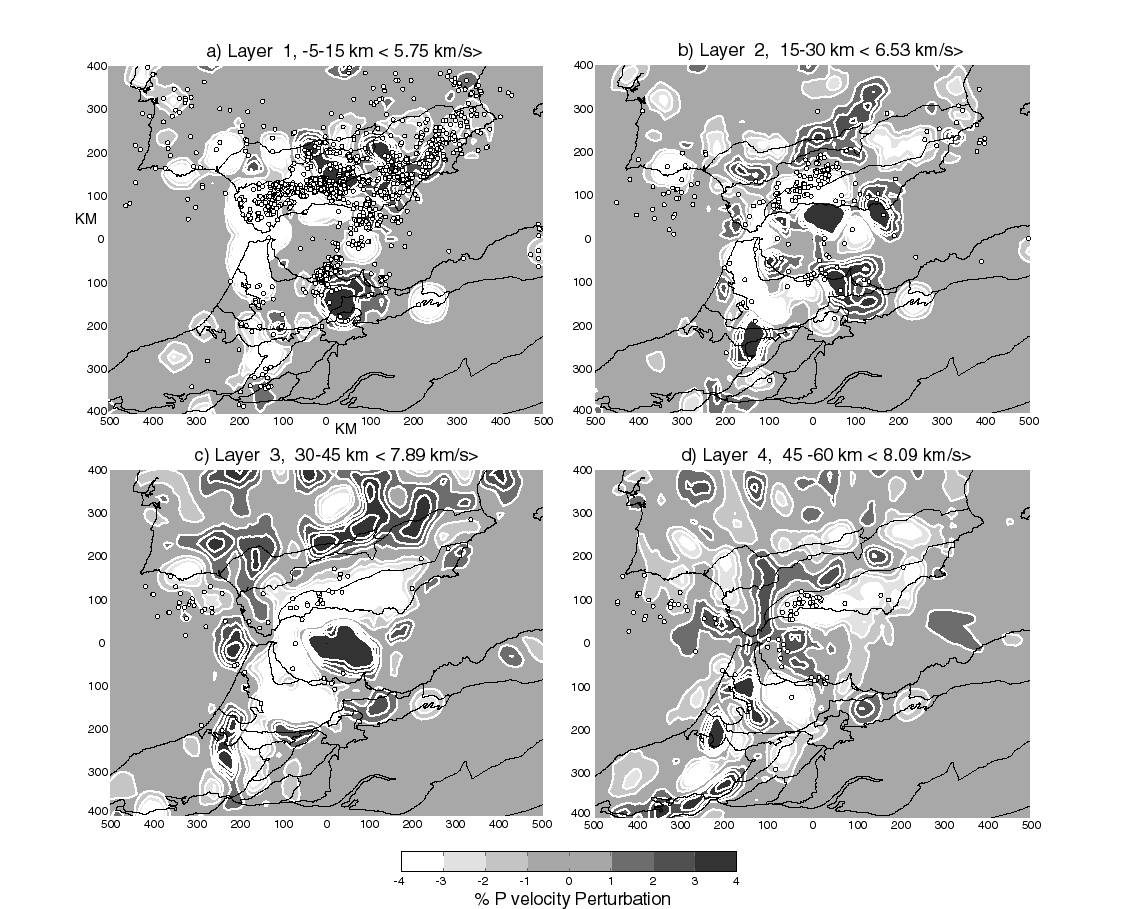
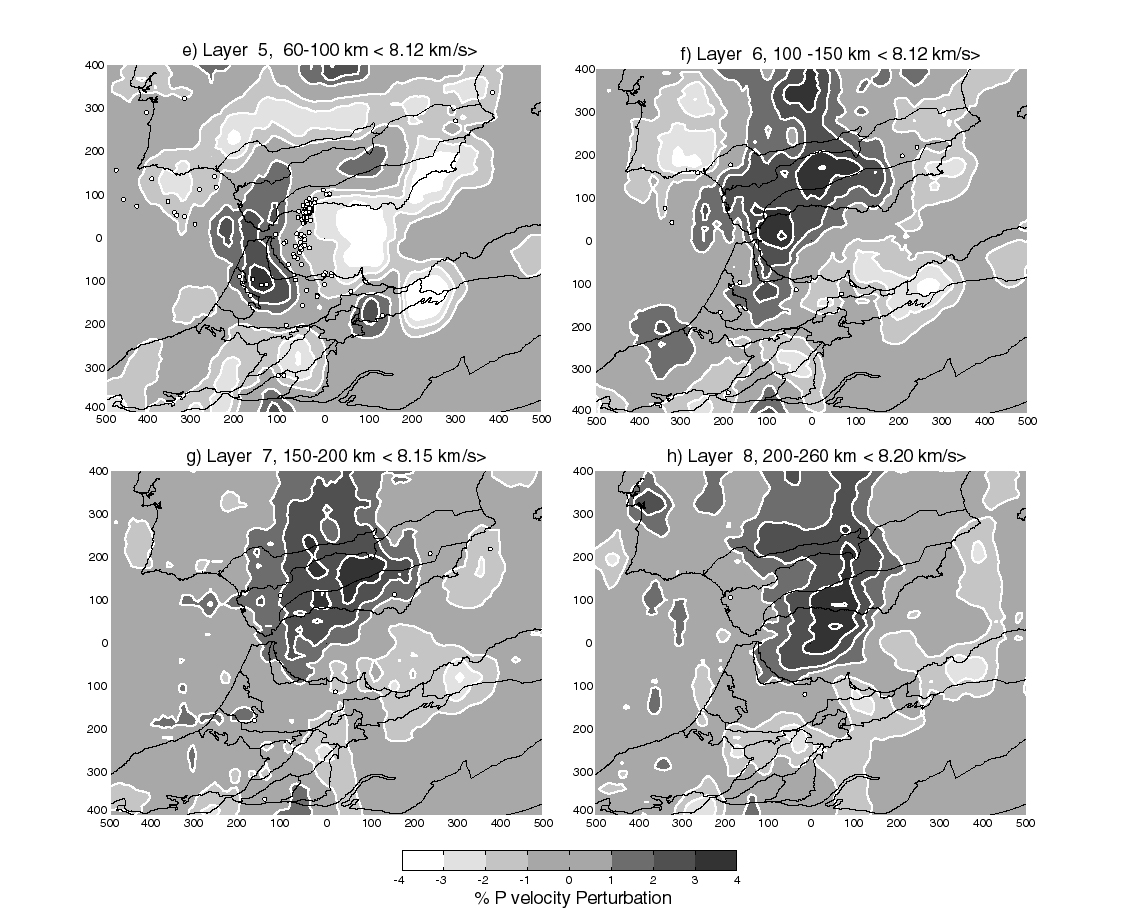
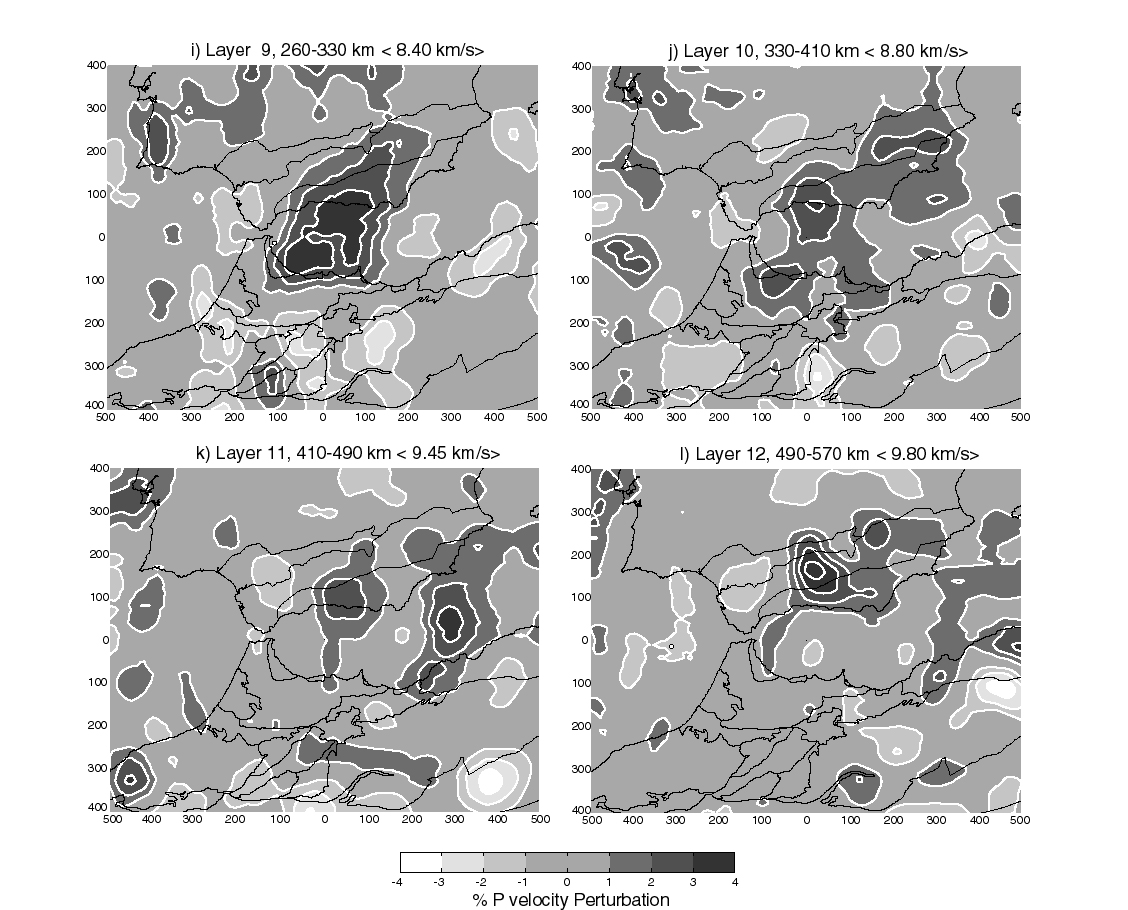
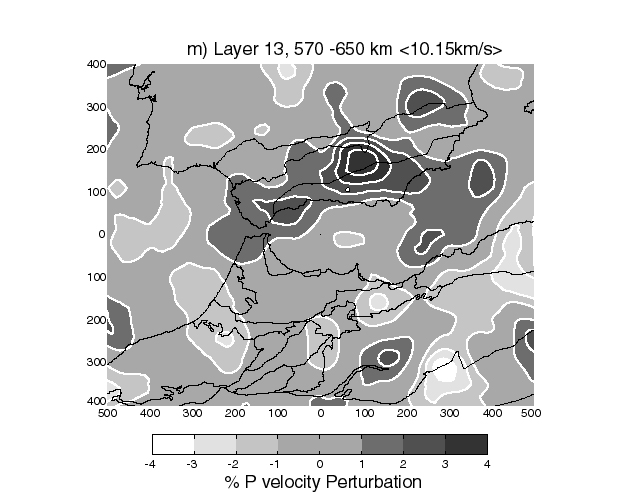
Figure 11.
Horizontal slices through the center of each layer of the final P velocity model. Bracketed term in the title is the reference velocity. Darker and lighter gray shades indicate regions of higher and lower velocities relative to reference model, respectively. Earthquakes were relocated from the starting data set using the 3-D velocity model (same locations as Figure 4b) with poorly constrained events removed. Main features (see text for detail discussion): (a) low velocities in western Betics and Rif; (b) high-velocity anomaly off southern coast of Spain east of Malaga; (c) "horseshoe" of low velocities surrounding a high-velocity region in the central Alboran; (d) low velocities beneath Betics and Rif; (e) high-velocity beneath western Betics and Rif separated from a low-velocity along southern coast of Spain by intermediate depth earthquakes; (f)-(i) progression of high-velocity anomaly to south and east with depth beneath the Alboran Sea; (j) and (k) high-velocity anomaly becomes more diffuse; (l) and (m) more concentrated anomalies imaged in the vicinity of deep earthquakes. For full color versions of these figures go here.