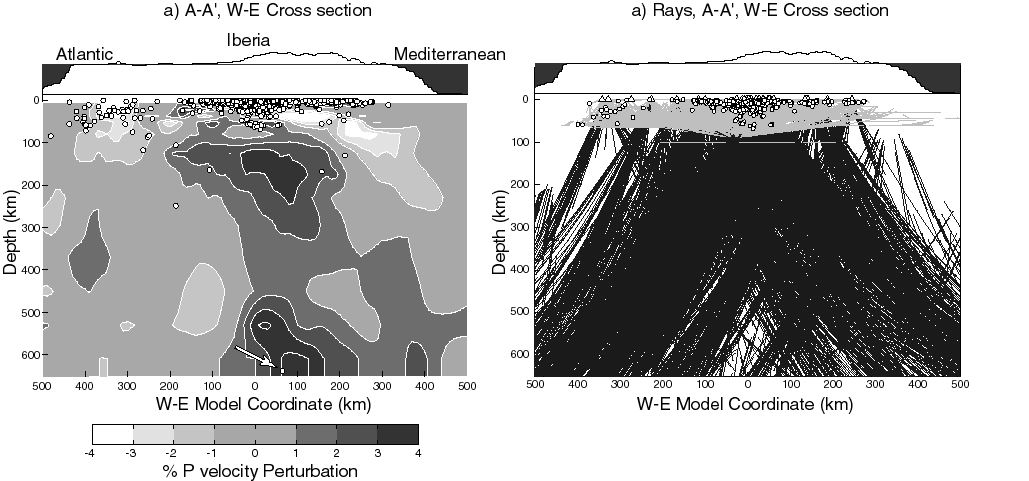
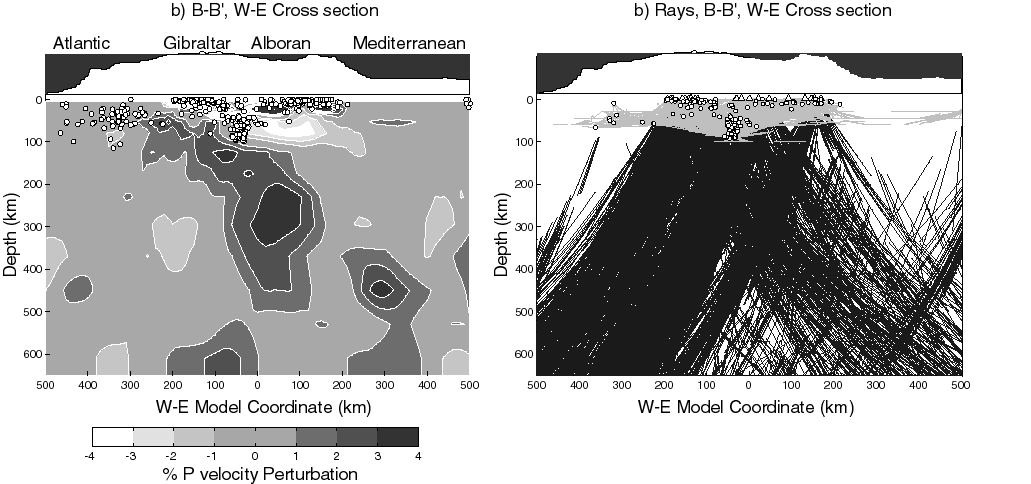
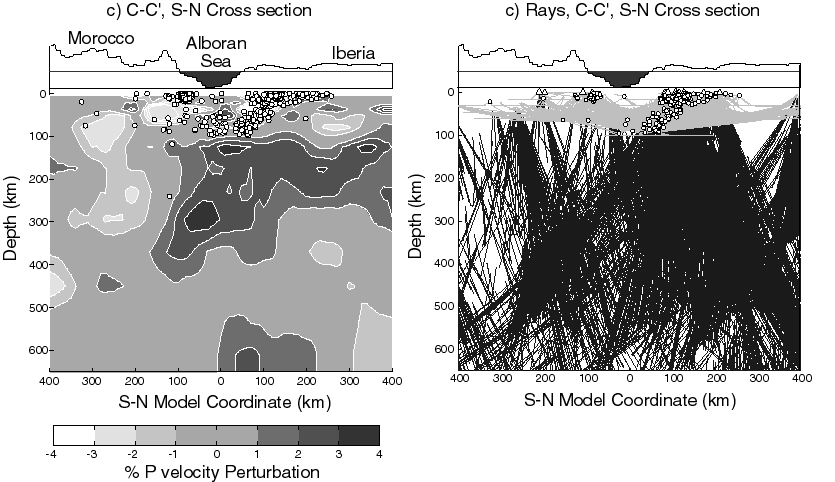
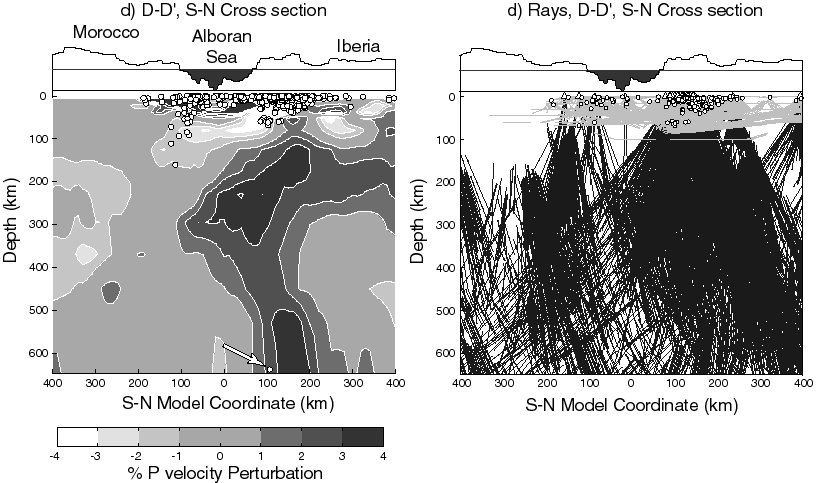
Figure 12.
Cross sections (a) AA', (b) BB', (c) CC', and (d) DD' of (left) P velocity model determined using block shift-and-average and (right) ray coverage. See Figure 8 for locations. Darker and lighter gray shades indicate regions of higher and lower velocities relative to reference model (Table 2), respectively. Gray rays are associated with local events and black rays are associated with teleseismic events. Earthquakes shown with ray plots are events actually used for the inversion. Earthquakes shown on the velocity model plots were relocated from the starting data set in the 3-D velocity model with poorly constrained events removed. Triangles are stations used for the inversion. Only earthquakes and ray segments located within 50 km of the cross sections are shown. A significant high-velocity anomaly is imaged in the upper mantle that appears to dip to the SE from lithospheric depths to approximately 350 km before becoming more diffuse. The intermediate depth earthquakes mark a west to east transition from high to low velocity in the uppermost mantle. Significant anomalies are also imaged at the base of the model near the location of the deep earthquakes (marked by arrows on AA’ and DD'). Only one of the three deep earthquake locations in the data set was sufficiently well constrained by arrivals in the region to be plotted. Color depth slices of the ray coverage may be found here.