DIGITAL DATABASE DEVELOPMENT
AND SEISMIC CHARACTERIZATION AND CALIBRATION FOR THE MIDDLE EAST AND NORTH
AFRICA
Muawia Barazangi, Dogan Seber, Eric Sandvol,
and Marisa Vallve
CORNELLĀUNIVERSITY
Institute for the
Study of the Continents (INSTOC)
Snee Hall, Ithaca,
NY 14853
(31 July 1996)
Abstract
It is essential for the CTBT monitoring efforts that multidisciplinary
information on any given region be readily available and accessible in
a digital, on-line format via electronic networks for use by concerned
researchers and decision makers. Our objective is
to collect and organize all available seismological, geophysical, and geological
data sets for the Middle East and North Africa into a comprehensive Geographic
Information System (GIS). In addition, we are producing original
results, such as crustal structure beneath available broadband seismic
stations, in areas where there is no available information. We are distributing
the organized databases in ArcInfo GIS format and menu driven access tools
and with a specially designed World Wide Web (WWW) server. Among the already
collected digital data sets are seismicity catalogs, focal mechanisms, and tectonic fault maps, as well as detailed Moho and basement maps, mine
locations, and various types of geophysics/geologic/geographic data for the Middle East region. We have also developed metadata to document the resolution and accuracy of the already organized data sets. The developed organized system and its efficiency in using and updating it will help CTBT researchers and decision makers to reach a conclusion in a very short time, including analyses of special (suspect) events and On Site Inspection efforts. Our
World Wide Web address for data distribution is http://atlas.geo.cornell.edu.
1. INTRODUCTION
2. DIGITAL DATABASE DEVELOPMENT FOR THE MIDDLE EAST
AND NORTH AFRICA
2 1. Menu Driven Access to Cornell Databases
2 1.1 Map Parameters
Set map limits
Set map projection
Latitude longitude grid
Add legend
2.1.2 Data Sets
Geographic data sets
Geophysical data sets
Geological data sets
Images and grids
2.1.3. User Input
2.1.4. Display Parameters
Zoom in and zoom out
Redraw
Line/marker/shade sets
Hard copy
2.1.5. Menu System Functions
Save algorithm and load algorithm buttons
Clear & reset all variables
Quit menu
2.2 World Wide Web (WWW) Access to Cornell Databases
3. ORIGINAL RESEARCH IN SUPPORT OF THE MIDDLE EAST
AND NORTH AFRICA GIS DATABASE DEVELOPMENT
3.2. Upper Crustal Seismic Velocity Structure in Eastern
Syria
3.2.1 Introduction
3.2.2 Method
3.2.3 Conclusions
3.3 Receiver Function Inversion in the Middle East
and North Africa
3.3.1 Introduction
3.3.2 Data
3.3.3 Inversion Method
3.3.4 Results
4. REFERENCES
APPENDIX I: LIST OF AVAILABLE DATA SETS
LIST OF FIGURES
1. INTRODUCTION
With the anticipated completion of a multilateral comprehensive nuclear
test ban treaty in the near future, it is essential for monitoring efforts
that multidisciplinary "reference" information on any given region
is readily available and accessible in a digital, on-line format via electronic
networks or on host computers for use by concerned researchers and decision
makers. We are building, organizing, and updating a digital geophysical
and geological information system for the Middle East and North Africa
region and conducting original seismological studies to characterize and
calibrate complex tectonic structures of the region for the purpose of
adding accurate results into the developed GIS databases. Our databases
and results will be of direct relevance to the US efforts in enhancing
regional seismic monitoring and discrimination capabilities, and to the
implementation and operation of the US NDC and monitoring efforts. Crustal
and lithospheric structure variations as well as major topographic relief
along regional seismic wave propagation paths and at the source and receiver
sites are crucial information to understand the excitation and propagation
of high- frequency regional seismic phases, and other aspects of the problems
of verification and estimation of the yield of nuclear and chemical explosions.
We digitized all available crustal scale profiles in the Middle East region.
By using these interpretations we produced a more detailed and accurate
Moho and basement maps which can be used in modeling efforts. We developed
the first digital tectonic map of the Middle East. We are also concentrating
on "metadata" information for all the developed databases. Each
data set entered into the system is accompanied by type of information
indicating resolution, accuracy, limitations of the databases. Data access
tools are also an important part of the whole system, since it would be
very cumbersome to access a specific data set among all types of databases
that are kept on the system. The newly developed system allows a user to
search, manipulate, and interact with the databases with ease and efficiency.
2. DIGITAL DATABASE DEVELOPMENT FOR THE MIDDLE EAST
AND NORTH AFRICA
We continuously add more information into our database in order to construct
a complete crustal structure database as well as other types of geophysical
and geological databases for the Middle East and North Africa. The database
system is divided into four different categories: Geographic, geologic,
geophysical, and imagery. In this annual report, we present all available
data and access tools that we have developed during the past year. The
entire database system is developed on an ArcInfo GIS system. All data
are kept in ArcInfo format and can be accessed through custom designed,
menu-driven access tools. The entire system is self sufficient and requires
no prior knowledge of ArcInfo software commands. A user can search, study,
manipulate, download and make hard copies of any part of the database
using this menu-driven system. One of the biggest advantage of the developed
system is that all the data are available in one computer and the user
can select and display any part of the various databases. Multiple layers
of data sets can be displayed in the same graphic window allowing the user
to comprehend the study area in its entirety.
2.1. Menu Driven Access to Cornell Databases
Accessing the entire database is through the main control menu (Figure
1). A colored topography image showing the 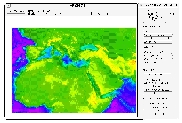 Middle
East and North Africa region is also displayed on a separate window (Figure
1). This is the default setting. The main menu includes several buttons
grouped together according to their function, such as map parameters
buttons, database access buttons, map display buttons, and various system
and auxiliary buttons. There are two types of buttons used in the menu
driven systems: check buttons and regular buttons. Check buttons are usually
used to display individual data sets and are activated as soon as
they are checked. Regular menu buttons are used for either an action
or to start up a new submenu; those which start up additional submenus
have three dots at the end of the function names.
Middle
East and North Africa region is also displayed on a separate window (Figure
1). This is the default setting. The main menu includes several buttons
grouped together according to their function, such as map parameters
buttons, database access buttons, map display buttons, and various system
and auxiliary buttons. There are two types of buttons used in the menu
driven systems: check buttons and regular buttons. Check buttons are usually
used to display individual data sets and are activated as soon as
they are checked. Regular menu buttons are used for either an action
or to start up a new submenu; those which start up additional submenus
have three dots at the end of the function names.
2.1.1 Map Parameters
This section in the menu system is used for setting up a map area to
work on and to annotate the map. There are four regular menu buttons each
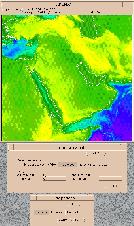
starting a new sub menu. Set map limits The set map limits button is used for
establishing a region of interest in the Middle East and North Africa region.
The region of interest is set either by clicking on one of
 the
three regional area buttons: Middle East and North Africa (this is the
default), Middle East, and North Africa or by just typing the lower left and upper right longitude and latitude
values of the area of interest (Figure
2). Done and Cancel buttons will quit this sub menu with or without
performing the action, respectively. Set map projection The set map projection
button allows one to select a map projection to be used during the session
(Figure 2). It is possible to change the projection
at any time during a session. All data sets except imagery and gridded
data sets are stored in geographic coordinates. Map projection is handled
on the fly as one requests a new data set to be plotted in the graphics
window. The default projection is Mercator. All image and grid files are
stored in Mercator projection. In order to display them Mercator projection
must be defined. A warning message will be displayed if a user attempts
to display an image file when a different projection is active.
the
three regional area buttons: Middle East and North Africa (this is the
default), Middle East, and North Africa or by just typing the lower left and upper right longitude and latitude
values of the area of interest (Figure
2). Done and Cancel buttons will quit this sub menu with or without
performing the action, respectively. Set map projection The set map projection
button allows one to select a map projection to be used during the session
(Figure 2). It is possible to change the projection
at any time during a session. All data sets except imagery and gridded
data sets are stored in geographic coordinates. Map projection is handled
on the fly as one requests a new data set to be plotted in the graphics
window. The default projection is Mercator. All image and grid files are
stored in Mercator projection. In order to display them Mercator projection
must be defined. A warning message will be displayed if a user attempts
to display an image file when a different projection is active. 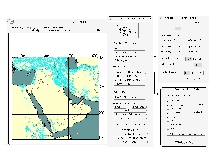 In
this release there is no option of using a user defined projection. This
will be added to the system in future releases. Latitude longitude grid
This button is used to add a latitude longitude grid and grid labels to
the map. A sub menu allowing the user to choose a grid interval and label the
interval and their locations appears on the screen (Figure
3). After typing the desired numbers and checking the On button, the grid
is displayed once the Done button is clicked. It is also possible to set
the label format with this menu. Grid label formats are DD, DDM, and DMS
representing Decimal Degree, Decimal Degrees - Minutes, and Decimal Degrees
- Minutes - Seconds, respectively. Add legend This button is used to add
a legend for the map that is displayed on the screen. Not all data sets
can be seen in the legend. It is possible to have items like tectonic units,
mine location, crustal profile locations, but items like coast lines, country
borders will not appear in the legend box. It is automatically determined
which items are displayed on the screen and the appropriate items are placed
in the legend box, the position and scale of which can be adjusted manually
to fit the screen.
In
this release there is no option of using a user defined projection. This
will be added to the system in future releases. Latitude longitude grid
This button is used to add a latitude longitude grid and grid labels to
the map. A sub menu allowing the user to choose a grid interval and label the
interval and their locations appears on the screen (Figure
3). After typing the desired numbers and checking the On button, the grid
is displayed once the Done button is clicked. It is also possible to set
the label format with this menu. Grid label formats are DD, DDM, and DMS
representing Decimal Degree, Decimal Degrees - Minutes, and Decimal Degrees
- Minutes - Seconds, respectively. Add legend This button is used to add
a legend for the map that is displayed on the screen. Not all data sets
can be seen in the legend. It is possible to have items like tectonic units,
mine location, crustal profile locations, but items like coast lines, country
borders will not appear in the legend box. It is automatically determined
which items are displayed on the screen and the appropriate items are placed
in the legend box, the position and scale of which can be adjusted manually
to fit the screen.
2.1.2 Data Sets
Under the data sets segment of the main menu there are four buttons
representing our four categories of data classes: Geographic, geophysical,
geological, and images/grids. This segment forms a bridge to access all Cornell databases on the Middle East and North Africa region.
Geographic data sets
Geographic data sets are kept and accessed through this menu
button. All geographic data sets were extracted from the Digital Chart
of the World CD-Rom. The data are from 1,000,000 scale maps. We extracted
polygons covering land and ocean areas in the Middle East and North Africa
region as well as coast lines, country borders, rivers, lakes, main roads,
and main city locations. All of these data are accessible through check
buttons which are activated as soon as they are checked. Figure 3 shows
an example of how this menu is used. The metadata related to these geographic
data are kept under the metadata sub menu. By clicking this menu button
a new sub menu is activated and the user is asked for which data set metadata
information is needed (Figure 4). A text window
appears displaying detailed explanations. It is also possible to highlight the
boundaries of a country by using the "select and shade some countries"
button; this button activates another sub menu which allows one to select
a few country names to be highlighted. It can be used when a user is
working on a country and wants to highlight it to differentiate it from the
surrounding countries.
Geophysical data sets Geophysical data sets are
grouped under three different categories: seismicity related, seismic station
coverage, and 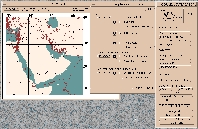 crustal
scale cross sections (Figure 5). We have entered
the two main earthquake catalogues available for the past several years,
the USGS PDE catalog and the International Seismological Center's earthquake
catalogue. The PDE catalog covers all events between 1960 and 1990 in the
Middle East and North Africa region. The ISC catalogue covers seismicity
between 1987 and 1992. All attributes related to each event such as location,
depth, origin time, magnitude are also entered into the system. In Figure
5 an example of the ISC seismicity catalogue is shown for a selected
region in the Middle East. The symbols are automatically scaled to events'
magnitudes, and it is possible to obtain information on any event by clicking
on the event with the mouse. The third kind of data set developed is the
Harvard earthquake focal mechanism solutions. A sub menu all
crustal
scale cross sections (Figure 5). We have entered
the two main earthquake catalogues available for the past several years,
the USGS PDE catalog and the International Seismological Center's earthquake
catalogue. The PDE catalog covers all events between 1960 and 1990 in the
Middle East and North Africa region. The ISC catalogue covers seismicity
between 1987 and 1992. All attributes related to each event such as location,
depth, origin time, magnitude are also entered into the system. In Figure
5 an example of the ISC seismicity catalogue is shown for a selected
region in the Middle East. The symbols are automatically scaled to events'
magnitudes, and it is possible to obtain information on any event by clicking
on the event with the mouse. The third kind of data set developed is the
Harvard earthquake focal mechanism solutions. A sub menu all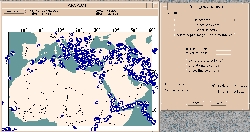 ows
the user either to choose all focal mechanisms to display or to select a region
or specific event and display the focal mechanisms. It is also
possible to see all attributes of any selected event in the database (Figures
6 and 7). Another geophysical data set contains the short period and broad band
seismic station locations in the
ows
the user either to choose all focal mechanisms to display or to select a region
or specific event and display the focal mechanisms. It is also
possible to see all attributes of any selected event in the database (Figures
6 and 7). Another geophysical data set contains the short period and broad band
seismic station locations in the 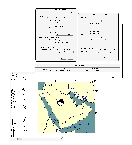 Middle
East and North Africa region (Figure 8). Although
the list is not complete at this time, in the near future we will be adding
more local network stations from the other countries of the region. The
broad band station coverage, however, is complete. Each broad band station
also includes basic information about them such as which seismic network
that they belong to and when the station started operating. This information
can be obtained by clicking the "i" button on the left and then
clicking on the station of interest. Crustal scale profile locations and
their interpretations also form a significant part of the geophysical databases.
Figures 9 and 10 show
the profile locations. The interpretations of selected three profiles are
shown in Figure 10. Both gravity and seismic
refraction profiles were digitized and entered in the database system.
Each interface is assigned values representing either seismic velocity
or density values above and below the interfaces. These profiles can be
dumped into an ascii file for use in modeling programs. These profiles
are also used as constraining points to more detailed Moho and basement
maps that are being developed for the region. We also added information
about the quality of the profiles. These kinds of information can be obtained
by selecting the "i" button and then clicking on any profile
in the database (Figure 9).
Middle
East and North Africa region (Figure 8). Although
the list is not complete at this time, in the near future we will be adding
more local network stations from the other countries of the region. The
broad band station coverage, however, is complete. Each broad band station
also includes basic information about them such as which seismic network
that they belong to and when the station started operating. This information
can be obtained by clicking the "i" button on the left and then
clicking on the station of interest. Crustal scale profile locations and
their interpretations also form a significant part of the geophysical databases.
Figures 9 and 10 show
the profile locations. The interpretations of selected three profiles are
shown in Figure 10. Both gravity and seismic
refraction profiles were digitized and entered in the database system.
Each interface is assigned values representing either seismic velocity
or density values above and below the interfaces. These profiles can be
dumped into an ascii file for use in modeling programs. These profiles
are also used as constraining points to more detailed Moho and basement
maps that are being developed for the region. We also added information
about the quality of the profiles. These kinds of information can be obtained
by selecting the "i" button and then clicking on any profile
in the database (Figure 9).
Geological data sets
are the third kind of database under development.
Up to the present time we have developed a complete tectonic map of the
Middle East region and mine locations in some selected countries (i.e.,
Iran, Iraq, Libya, Algeria). The tectonic map of the Middle East is composed
of nine separate elements: Faults, volcanics (Neogene/Quaternary), volcanics
(Paleogene), ophiolites, volcanoes active, volcanoes (inactive), basement
outcrop locations, basement depth contours, and some major depression locations
(Figure 11). These items are digitized
from several maps from individual countries and merged carefully to create
this first digital tectonic map of the region. Each of these nine features
was assigned appropriate attributes. For example, in order to obtain some
information about a certain fault in the region, the user only needs to
select the correct "i" button and then click on the fault that
is of interest. Available information on the type of fault and whether it is active will be displayed on the screen. Mine locations in
some of the Middle East and North Africa countries were also entered in
the database. An example is shown in Figure 12.
In each country shown, the producing and prospect mine locations are marked
separately. It is also possible to obtain information about these mine
sites by simply clicking on any selected mine location. The type of mine and
what is mined will be displayed on the screen in a text window.
Images and grids
Image and grid files form the fourth type of databases. Databases
included in this category include topography, hill shaded representation
of topography, basement depth, moho depth, Bouguer gravity, free air gravity,
and Landsat TM imagery. The topography data in our databases is 1 km in
resolution and obtained from the USGS based on DMA's higher resolution
topography data. We added ETOPO5's bathymetry data and merged these two
data sets to obtain a full coverage for the entire area of interest (Figure
1). The second kind of topography data set is the hill-shaded representation
of the same topography data, which highlights the
relief and gives the image a three-dimensional perspective. The third data
set under this category is the basement depth map obtained from the Institute
of the Physics of the Earth (IPE) of the former Soviet Union. Although
this map has accuracy problems, it still gives first order differences
in sediment thickness in the region. The fourth data set is the Moho depth
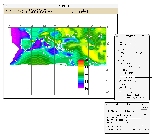 map
(Figure 13), also obtained from
the IPE publications. Similar to the basement map, it has accuracy
problems and should only be used to see the first order changes in Moho
depth. Another type of geophysical database in the images
and gridded data set is the Bouguer gravity and free air gravity values
for parts of the Middle East and North Africa region (Figure
14). This map was obtained from several sources. Gravity values from
Syria, Lebanon, Israel, Egypt and parts of the western
map
(Figure 13), also obtained from
the IPE publications. Similar to the basement map, it has accuracy
problems and should only be used to see the first order changes in Moho
depth. Another type of geophysical database in the images
and gridded data set is the Bouguer gravity and free air gravity values
for parts of the Middle East and North Africa region (Figure
14). This map was obtained from several sources. Gravity values from
Syria, Lebanon, Israel, Egypt and parts of the western 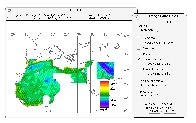 Mediterranean
region came from digitized contoured gravity maps. The rest of the areas
have point readings. These two kinds of data sets were merged and the entire
data set was gridded (Figure 14). The free air
gravity values cover a smaller area and they were gridded using only point
data. Also kept under the gravity databases are original point and contour
files. These can be displayed using the sub menu called "coverages
used" (Figure 15). These data give
an indication of the reliability of the gridded data for a given region. The
metadata button in the same menu gives further information about the data
such as the source, contact person, addresses etc. (Figure
16). Another important tool that was developed is the "profile
maker". This tool can
Mediterranean
region came from digitized contoured gravity maps. The rest of the areas
have point readings. These two kinds of data sets were merged and the entire
data set was gridded (Figure 14). The free air
gravity values cover a smaller area and they were gridded using only point
data. Also kept under the gravity databases are original point and contour
files. These can be displayed using the sub menu called "coverages
used" (Figure 15). These data give
an indication of the reliability of the gridded data for a given region. The
metadata button in the same menu gives further information about the data
such as the source, contact person, addresses etc. (Figure
16). Another important tool that was developed is the "profile
maker". This tool can 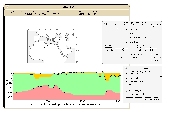 be
used to extract profiles along two arbitrary points either typed in or
selected from the screen. Using this tool one can either extract the values
be
used to extract profiles along two arbitrary points either typed in or
selected from the screen. Using this tool one can either extract the values
 along
two points in any of these gridded data sets or make crustal scale profiles
including topography, basement, and Moho depths (Figure
17). This tool can be used to extract a profile and download the values
into an ascii file that can be used with other modeling programs. For example,
the crustal structure between a seismic event and station can be extracted.
This 2-D crustal profilel can then be used for producing synthetic seismograms.
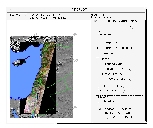
The last type of data under this category is Landsat TM imagery. We have
a significant amount of TM coverage in North Africa and the Middle East.
However, in this release we only provide a TM coverage along the entire
Dead Sea fault system (Figure 18). This is a
mosaic of 5 original TM scenes. The other TM scenes we have are being processed
and will be made available in future releases.
along
two points in any of these gridded data sets or make crustal scale profiles
including topography, basement, and Moho depths (Figure
17). This tool can be used to extract a profile and download the values
into an ascii file that can be used with other modeling programs. For example,
the crustal structure between a seismic event and station can be extracted.
This 2-D crustal profilel can then be used for producing synthetic seismograms.
The last type of data under this category is Landsat TM imagery. We have
a significant amount of TM coverage in North Africa and the Middle East.
However, in this release we only provide a TM coverage along the entire
Dead Sea fault system (Figure 18). This is a
mosaic of 5 original TM scenes. The other TM scenes we have are being processed
and will be made available in future releases.
2.1.3. User Input Running ArcPlot commands
This part of the menu is designed for ArcInfo users. This menu can be
used when a user wishes to add an external data set to be displayed and
manipulated. The window allows five separate command lines to be executed.
These lines can also include run commands to execute longer Arc Macro Language
(AML) codes. Options include running the commands as first or last commands
(Figure 19).
2.1.4. Display Parameters
This part of the menu system is related to map display, color changes,
and hardcopy making. Zoom in and zoom out These two buttons are alternatives
to setting map area by the "set map limit" button discussed earlier.
The zoom in button allows interactive zoom in on the screen instead of
entering numbers. The zoom out button zooms out to the whole area of the Middle
East and North Africa. Redraw The redraw button is used after some changes
are made to display parameters. It automatically checks which options have
been checked and re-reads the parameters, and then displays the requested data
sets. Line/marker/shade sets This menu button is used to change default
colors and line and shade colors, and to resize the text, line thickness, point
symbol and size (Figure 20). Before displaying
the appropriate data sets, colors and symbols can be selected for each data
set, and then the data request button should be checked. The set values
are permanent for the work session. Once the system is quit, these set
parameters are lost. Hard copy This button is used to make a hard copy of
the screen. Most of the data sets can be plotted from this menu. A few
others have their own hardcopy buttons that should be used for that specific
purpose only. It is possible to make Postscript, GIF, Illustrator, and
CGM formatted hard copies (Figure 21). At this
time the system allows only page size copies. In future releases hard copies
based on map scales will be made available for larger maps. A user needs
to define a directory path and a file name. Extension will be added according
to hardcopy format selected.
2.1.5. Menu System Functions Save algorithm and load algorithm buttons
These two menu buttons are used in saving a user environment, and loading
it back to the system as needed (Figure 22).
The save algorithm button is used once a user progresses in setting up data
sets that are of interest, color and symbol sizes, and map area. All these
environment variables can be saved into a file that will be used at a later
session. This allows to re-establish several pre-setup conditions with
ease. Clear & reset all variables This button is used to refresh and
re-establish the default variables. Quit menu This button terminates the
whole session and exits from the databases.
2.2 World Wide Web (WWW) Access to Cornell Databases
Considering that access to ArcInfo software is not available for several
research groups, we are also developing an ArcInfo - WWW interface to our
developed databases. A prototype system is now available and functioning
well. With this release we are switching our regular Web address and host
computer from a shared system to a specifically designated computer with
a new address. A SUN Ultra 1 server has been established to speedily serve
data sets to CTBT researchers. Our new web address is "http://atlas.geo.cornell.edu"
Access to ArcInfo databases is provided through a specially designed program.
We are trying to keep the architecture in the Web pages as close to those
in ArcInfo menu system as possible. Although this will not give as much
flexibility in data manipulation, 80-90% of the menu driven functionalities
available in the menu driven system will be preserved under this system
(Figures 23 and 24).
3. ORIGINAL RESEARCH IN SUPPORT OF THE MIDDLE EAST
AND NORTH AFRICA GIS DATABASE DEVELOPMENT
Another essential component to our GIS development is the addition of
new geophysical databases that we are incorporating into our GIS. The research
we are pursuing is designed to address those regions and datasets that
previously have not been investigated. We are presenting here three different
areas of research that have helped make the information available in our
GIS databases more complete.
3.1 Discrimination of Chemical Explosions in Morocco
3.1.1 Introduction
To examine the limitations in the techniques for discriminating between
chemical explosions and earthquakes at local and regional distances, we
have applied several standard heuristics to seismic events in northwest
Morocco where little a priori information was 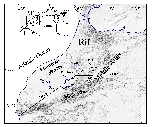 available.
Although the 8 Oud Zem phosphate mine explosions (see Figure
25) have similar geographic locations, total charge magnitudes, and
presumably ripple fired mechanisms, the seismic recordings are characterized
by a surprising amount of diversity. Time and path independent modulations,
owing to the periodic source mechanism of the ripple fired explosions,
rarely unequivocally distinguish the explosions from the earthquakes. Our
findings imply that more often than the current literature suggests, source
inconsistencies have a role in the failure of common discriminants. Furthermore,
crustal seismic velocity and the attenuation structure seemed to shape
the seismic signals more than the nature of the source mechanism. The 10-15
Hz Pg/Sg ratio test proved to be the most precise and accurate discriminant.
Finally, we argue that a regional case-based approach requires extensive
regional information to meet the demanding verification goals of the proposed
Comprehensive Test Ban Treaty. Large industrial explosions for mining and
excavating are almost always chemical explosions which can be as large
as 500 metric tons (Smith, 1989). Usually chemical explosions over a few
tons are actually a series of time-delayed sub-explosions, or ripple fired
explosions, whose spatial and temporal layout are determined by the purpose
of the explosion, the topography, and the equipment available for the blasts.
The source multiplicity inherent in ripple fired explosions is often the
characteristic used to discriminate large chemical explosions from nuclear
explosions and earthquakes (e.g., Baumgardt and Ziegler, 1988; Smith, 1989;
Kim et al., 1994). Various compressional and shear wave ratios (amplitude
and spectral) have been used to discriminate between all types of explosions
and earthquakes, in an attempt to apply the basic physical conclusion that
explosions excite more compressional waves than earthquakes relative to
shear waves (e.g., Pomeroy et al., 1982; Taylor et al., 1989; Kim et al.,
1994; Walter et al., 1995). This study applies many of the techniques and
tools mentioned above to a new geologic setting, Morocco, under less favorable
circumstances. The constraints and limitations of spectral discrimination
techniques will be qualitatively explored by examining source and path
effects. Also, some of the previously cited discrimination methods will
be employed in an attempt to develop a systematic discriminant that minimizes
case-by-case analyses. To some extent, our study can serve as an assessment
of current discrimination techniques in a complicated world of inadequate
information. Attention will be paid to failures, particularly when those
failures could be a result of geologic conditions, such as crustal structure.
The seismic events and stations used in this study are located in northwest
Morocco (Figure 25). The collision of the African
and Eurasian plates governs Morocco's geomorphology (e.g., Jacobshagen
et al., 1988). The Atlas mountains of Morocco are an active intracontinental
mountain system composed of two inverted Mesozoic rift systems: the High
Atlas that runs approximately east-west, and the Middle Atlas that trends
northeast and merges into the interplate Beltic-Rif mountain system. Although
most refraction velocity profile data for the Moroccan crust and uppermost
mantle are not well established, two studies provide pertinent, but approximate,
profile information about the two paths. The Makris et al. (1985) profile
(labeled "Makris" in Figure 25) showed that the direct P-wave
travels at a velocity of 5.5 km/s and is finally overtaken by Pg after
nearly 40 km at an apparent velocity of 6.0 km/s, because the thickness
of the sediments is almost 4 km and the velocity contrast is small. The
Pn velocity is somewhat slow at 7.8 km/s and does not appear as the first
arrival until approximately 140 km, if it can be seen over the background
noise. Also, Makris et al. found an Sg apparent velocity to be approximately
3.3 km/s homogeneous along the profile, and the Moho to be about 30 km
deep. Wigger et al. (1992) found from their profile (labeled "Wigger"
in Figure 25) the Moho's depth to be approximately 35 km with an average
Pn velocity at the uppermost mantle of about 7.7-7.9 km/s, also relatively
slow, as was found in the Makris et al. profile. They also determined that
the maximum thickness of the crust was under the northern border of the
High Atlas at 38-39 km.
available.
Although the 8 Oud Zem phosphate mine explosions (see Figure
25) have similar geographic locations, total charge magnitudes, and
presumably ripple fired mechanisms, the seismic recordings are characterized
by a surprising amount of diversity. Time and path independent modulations,
owing to the periodic source mechanism of the ripple fired explosions,
rarely unequivocally distinguish the explosions from the earthquakes. Our
findings imply that more often than the current literature suggests, source
inconsistencies have a role in the failure of common discriminants. Furthermore,
crustal seismic velocity and the attenuation structure seemed to shape
the seismic signals more than the nature of the source mechanism. The 10-15
Hz Pg/Sg ratio test proved to be the most precise and accurate discriminant.
Finally, we argue that a regional case-based approach requires extensive
regional information to meet the demanding verification goals of the proposed
Comprehensive Test Ban Treaty. Large industrial explosions for mining and
excavating are almost always chemical explosions which can be as large
as 500 metric tons (Smith, 1989). Usually chemical explosions over a few
tons are actually a series of time-delayed sub-explosions, or ripple fired
explosions, whose spatial and temporal layout are determined by the purpose
of the explosion, the topography, and the equipment available for the blasts.
The source multiplicity inherent in ripple fired explosions is often the
characteristic used to discriminate large chemical explosions from nuclear
explosions and earthquakes (e.g., Baumgardt and Ziegler, 1988; Smith, 1989;
Kim et al., 1994). Various compressional and shear wave ratios (amplitude
and spectral) have been used to discriminate between all types of explosions
and earthquakes, in an attempt to apply the basic physical conclusion that
explosions excite more compressional waves than earthquakes relative to
shear waves (e.g., Pomeroy et al., 1982; Taylor et al., 1989; Kim et al.,
1994; Walter et al., 1995). This study applies many of the techniques and
tools mentioned above to a new geologic setting, Morocco, under less favorable
circumstances. The constraints and limitations of spectral discrimination
techniques will be qualitatively explored by examining source and path
effects. Also, some of the previously cited discrimination methods will
be employed in an attempt to develop a systematic discriminant that minimizes
case-by-case analyses. To some extent, our study can serve as an assessment
of current discrimination techniques in a complicated world of inadequate
information. Attention will be paid to failures, particularly when those
failures could be a result of geologic conditions, such as crustal structure.
The seismic events and stations used in this study are located in northwest
Morocco (Figure 25). The collision of the African
and Eurasian plates governs Morocco's geomorphology (e.g., Jacobshagen
et al., 1988). The Atlas mountains of Morocco are an active intracontinental
mountain system composed of two inverted Mesozoic rift systems: the High
Atlas that runs approximately east-west, and the Middle Atlas that trends
northeast and merges into the interplate Beltic-Rif mountain system. Although
most refraction velocity profile data for the Moroccan crust and uppermost
mantle are not well established, two studies provide pertinent, but approximate,
profile information about the two paths. The Makris et al. (1985) profile
(labeled "Makris" in Figure 25) showed that the direct P-wave
travels at a velocity of 5.5 km/s and is finally overtaken by Pg after
nearly 40 km at an apparent velocity of 6.0 km/s, because the thickness
of the sediments is almost 4 km and the velocity contrast is small. The
Pn velocity is somewhat slow at 7.8 km/s and does not appear as the first
arrival until approximately 140 km, if it can be seen over the background
noise. Also, Makris et al. found an Sg apparent velocity to be approximately
3.3 km/s homogeneous along the profile, and the Moho to be about 30 km
deep. Wigger et al. (1992) found from their profile (labeled "Wigger"
in Figure 25) the Moho's depth to be approximately 35 km with an average
Pn velocity at the uppermost mantle of about 7.7-7.9 km/s, also relatively
slow, as was found in the Makris et al. profile. They also determined that
the maximum thickness of the crust was under the northern border of the
High Atlas at 38-39 km.
3.1.2 Data
The Oud Zem phosphate mines in the Moroccan Meseta provide an opportunity
to analyze recordings produced by ripple fired explosions significantly
different from those already noted in the literature (Figure
25). After subjecting all available explosion seismograms to a number
of tests, the explosion population was trimmed down to 8 explosions (labeled
Xa through Xh) with a total of 33 recordings. Because of both their total
charge magnitude and their presumed purpose (phosphate surface mining),
the explosions are assumed to be ripple fired. Spatial-temporal layout
data independent of the seismic analysis were not available. Although the
orogenic regions of Morocco are seismically active, the same cannot be
said of the Moroccan Meseta near the phosphate mines. After searching through
a database of hundreds of recent Moroccan seismic events, only 6 (labeled
Qa through Qf) events were found that might have propagation paths
similar to that of the explosions. After subjecting the seismograms of these events to a number of tests like those of the explosions, the record population
was reduced to only 13 recordings. Each of the non-Oud Zem phosphate mine
events were located usually using about 5 or 6 recordings. Owing to typical
errors found in hypocenter inversions, the locations could vary by several
kilometers. Finally, not all of the seismic events (labeled as earthquakes)
are necessarily earthquakes. Qb and Qc are located near a region known
to have had phosphate mines at one time, but they are not located on the
active phosphate mines themselves. The origin times of Qb and Qc are both
in the early evening. Most of the known explosions, however, were blasted
in mid-afternoon. Qd is most certainly an explosion, but it is still not
labeled as such since it cannot be independently confirmed as an explosion.
It is located near the phosphate mines, but once again it is not on the
known mines themselves. The Qd origin time is in mid-afternoon, prime time
for the explosions.
3.1.3 Processing Methods
Only short period seismic stations with 1 Hz geophones that recorded
both earthquakes and explosions in proportionate numbers were included
in the analysis in order to control for station effects and thus to allow
direct comparisons between events. Recordings that have under a 2:1 rms
signal to noise ratio were eliminated from the population. These two tests
eliminated over 50 recordings for the events and disqualified 6 other events
completely. The seismic recordings of the 8 Oud Zem phosphate mine explosions
were characterized by a surprising amount of diversity in view of their
similar purpose, total charge magnitude, ripple-fired mechanism, and location.
While phase and path independent spectral scalloping were noticeable in
many of the signals to some extent, those features were hardly ubiquitous.
Furthermore, among the signals for which spectral modulation was clearly
evident, the frequencies of their maxima and minima were not related, even
for those cases where the propagation path, recording station, and total
charge size were similar. These 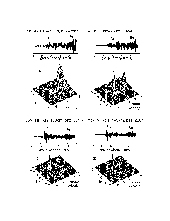 observations
suggest that the spatial-temporal arrangement of the source varied considerably,
whether intentionally as a result of blast requirements or crew preferences,
or as a result of misfirings. For example, Figure
26 shows the seismograms and velocity-frequency distributions for two
explosions, Xa and Xb, both comparable in magnitude and both exploded at
the Oud Zem site. The signals shown in Figures 26a and 26b are recorded
by the same seismograph station, KSI. Explosion Xa is much more coherent
and impulsive than explosion Xb. From Xa's spectrogram, two phase independent
modulations can be noted, one at about 3 Hz and the other at about 7 Hz.
From Xb's spectrogram, any phase independent modulations are not obvious
(the vertical scale of the spectrogram is linear, so possible scalloping
at higher frequencies is obscured). The destructive interference apparent
in Xb's spectrogram could be the result of a second blast bench, if it
is significant in charge size in relation to the initial rippled-fired
blast. This hypothesis is supported by a large arrival on Xb's seismogram
just after the section labeled Pg (in accordance with the Pg velocity window
established from the first motion). The brief listing for Xb in the blast
log only notes one blast bench, however. This abnormality is one of the
more conspicuous variations among the observed ripple fired source mechanisms.
Surficial features such as topography seemed to affect the seismic signals.
Figures 26c and 26d
are the recorded signals of explosions Xa and Xb, respectively, at station
TNF (Figure 25). The recordings' back-azimuths
to the location of the explosions are comparable to those at the KSI station.
The seismic signals from explosions Xa and Xb are similarly filtered presumably
by their propagation through the Middle-High Atlas junction. The Sg phase
is much more attenuated than the Pg phase. The resulting spectrograms are
dramatically different than their counterparts constructed from the signals
recorded at the KSI station. Note that at this distance, the consequences
of that postulated second blast bench to the velocity-frequency distribution
are minimal. Explosion Xa's spectrogram, Xa's modulations are much more
prominent than those of Xb. The phase independence of Xb's scalloping is
still not apparent. Propagation effects concealed differences between the
seismic signals of explosions and earthquakes. An explosion and earthquake
which were quite distinguishable at one station (whose back-azimuth and
distance to each event were similar), were in some cases much less distinguishable
by recordings at other stations. A representative case is that of explosion
Xb and earthquake Qe. For both events the Pg and Sg amplitudes recorded
at MSH are of the same order of magnitude, and the energy of the phases
is distributed similarly in frequency space. The explosion's Pg / Sg ratio
is larger than that of the earthquake, and more of the explosion's energy
spills over into higher frequencies. A comparison of explosion Xb's recording
at MSH with that at KSI and TNF shows the importance of azimuthal and propagation
effects, as well as highlights the similarities between Xb's and Qe's signal
at MSH. As seen in Figure 26, the scalloping
of the explosion signal is relatively consistent for the lower frequencies
inside of two path groups, that of CLZV and TNF, and that of KSI, MSH,
and TAZ. Above 8 Hz, the frequency maxima and minima within these groups
no longer correlate. As in Xb's case, for Qe's power spectra the lower
frequency maxima and minima of CLZV and TNF correlate. Because of the above
similarities, it is difficult to recognize path independent modulations
for one power spectrum and not the other. These observations indicate that
path dependencies, rather than source characteristics, seem to dominate
the signal's form. As discriminants, the most successful ratio tests were
the 5-10 Hz Pg / 5-10 Hz Sg and 10-15 Hz Pg / 10-15 Hz Sg spectral tests
(Figure 27). The variance in the performance
of both tests, due to differences in the recording station, was still considerable.
The spectral ratio tests within phases (e.g., 1-2 Hz Sg / 6-8 Hz Sg) were
unable to separate the explosions from the earthquakes. The Pg/Sg maximum
amplitude test was also ineffective. Any first order dependency on propagation
distance was removed from the ratios with a linear least squares fit. The
discriminant line was rather arbitrarily chosen as the median value of
the earthquakes. The authors are aware of statistical methods for selecting
the discriminant line (e.g., Elvers, 1974; Taylor et al., 1989; Woodward
and Gray, 1995), but as will be explicated below, our small and uncertain
training set does not warrant such approaches. If the two spectral discriminants
are integrated by a union (vis-a-vis intersection) and seismic information
from only a single station is available, then a single explosion recording
has a 12% probability of being classified as an earthquake, and a single
earthquake recording has a 23% probability of being classified as an explosion.
If all of the recordings of an event are used in the discrimination scheme
(a networked system), then only "earthquake" Qd would be "missclassified."
As already mentioned in the Data section, judging from a priori information
such as origin time and location, event Qd is most likely an explosion
and not an earthquake (but independent confirmation is not available through
blasting logs, etc., so the event is assumed to be an earthquake). If Qd
is considered an explosion in the training set, then the network approach
would classify every event correctly. Thus, since the original discriminant
is based on a flawed training set, its results represent a worst case scenario
which reflects some of the challenges of constructing a discriminant in
a world of uncertain and incomplete information.
observations
suggest that the spatial-temporal arrangement of the source varied considerably,
whether intentionally as a result of blast requirements or crew preferences,
or as a result of misfirings. For example, Figure
26 shows the seismograms and velocity-frequency distributions for two
explosions, Xa and Xb, both comparable in magnitude and both exploded at
the Oud Zem site. The signals shown in Figures 26a and 26b are recorded
by the same seismograph station, KSI. Explosion Xa is much more coherent
and impulsive than explosion Xb. From Xa's spectrogram, two phase independent
modulations can be noted, one at about 3 Hz and the other at about 7 Hz.
From Xb's spectrogram, any phase independent modulations are not obvious
(the vertical scale of the spectrogram is linear, so possible scalloping
at higher frequencies is obscured). The destructive interference apparent
in Xb's spectrogram could be the result of a second blast bench, if it
is significant in charge size in relation to the initial rippled-fired
blast. This hypothesis is supported by a large arrival on Xb's seismogram
just after the section labeled Pg (in accordance with the Pg velocity window
established from the first motion). The brief listing for Xb in the blast
log only notes one blast bench, however. This abnormality is one of the
more conspicuous variations among the observed ripple fired source mechanisms.
Surficial features such as topography seemed to affect the seismic signals.
Figures 26c and 26d
are the recorded signals of explosions Xa and Xb, respectively, at station
TNF (Figure 25). The recordings' back-azimuths
to the location of the explosions are comparable to those at the KSI station.
The seismic signals from explosions Xa and Xb are similarly filtered presumably
by their propagation through the Middle-High Atlas junction. The Sg phase
is much more attenuated than the Pg phase. The resulting spectrograms are
dramatically different than their counterparts constructed from the signals
recorded at the KSI station. Note that at this distance, the consequences
of that postulated second blast bench to the velocity-frequency distribution
are minimal. Explosion Xa's spectrogram, Xa's modulations are much more
prominent than those of Xb. The phase independence of Xb's scalloping is
still not apparent. Propagation effects concealed differences between the
seismic signals of explosions and earthquakes. An explosion and earthquake
which were quite distinguishable at one station (whose back-azimuth and
distance to each event were similar), were in some cases much less distinguishable
by recordings at other stations. A representative case is that of explosion
Xb and earthquake Qe. For both events the Pg and Sg amplitudes recorded
at MSH are of the same order of magnitude, and the energy of the phases
is distributed similarly in frequency space. The explosion's Pg / Sg ratio
is larger than that of the earthquake, and more of the explosion's energy
spills over into higher frequencies. A comparison of explosion Xb's recording
at MSH with that at KSI and TNF shows the importance of azimuthal and propagation
effects, as well as highlights the similarities between Xb's and Qe's signal
at MSH. As seen in Figure 26, the scalloping
of the explosion signal is relatively consistent for the lower frequencies
inside of two path groups, that of CLZV and TNF, and that of KSI, MSH,
and TAZ. Above 8 Hz, the frequency maxima and minima within these groups
no longer correlate. As in Xb's case, for Qe's power spectra the lower
frequency maxima and minima of CLZV and TNF correlate. Because of the above
similarities, it is difficult to recognize path independent modulations
for one power spectrum and not the other. These observations indicate that
path dependencies, rather than source characteristics, seem to dominate
the signal's form. As discriminants, the most successful ratio tests were
the 5-10 Hz Pg / 5-10 Hz Sg and 10-15 Hz Pg / 10-15 Hz Sg spectral tests
(Figure 27). The variance in the performance
of both tests, due to differences in the recording station, was still considerable.
The spectral ratio tests within phases (e.g., 1-2 Hz Sg / 6-8 Hz Sg) were
unable to separate the explosions from the earthquakes. The Pg/Sg maximum
amplitude test was also ineffective. Any first order dependency on propagation
distance was removed from the ratios with a linear least squares fit. The
discriminant line was rather arbitrarily chosen as the median value of
the earthquakes. The authors are aware of statistical methods for selecting
the discriminant line (e.g., Elvers, 1974; Taylor et al., 1989; Woodward
and Gray, 1995), but as will be explicated below, our small and uncertain
training set does not warrant such approaches. If the two spectral discriminants
are integrated by a union (vis-a-vis intersection) and seismic information
from only a single station is available, then a single explosion recording
has a 12% probability of being classified as an earthquake, and a single
earthquake recording has a 23% probability of being classified as an explosion.
If all of the recordings of an event are used in the discrimination scheme
(a networked system), then only "earthquake" Qd would be "missclassified."
As already mentioned in the Data section, judging from a priori information
such as origin time and location, event Qd is most likely an explosion
and not an earthquake (but independent confirmation is not available through
blasting logs, etc., so the event is assumed to be an earthquake). If Qd
is considered an explosion in the training set, then the network approach
would classify every event correctly. Thus, since the original discriminant
is based on a flawed training set, its results represent a worst case scenario
which reflects some of the challenges of constructing a discriminant in
a world of uncertain and incomplete information.
3.1.4 Discussion and Conclusions
The large regional variability of source mechanisms, source geologic
conditions, and propagation paths and the geophysical and seismological
community's relative lack of a comprehensive physical understanding of
propagation effects, have encouraged site-dependent, case-based approaches
for discriminating between earthquakes, industrial explosions, and nuclear
explosions. As shown by our study, the empirical heuristics utilized in
case-based approaches have limitations that must be considered by any CTBT
verification system. Our findings argue that more often than the current
literature suggests, source inconsistencies may result in the failure of
time independent spectral modulations to discriminate between earthquakes
and ripple-fired explosions. Specifically, we agree with the observations
of Baumgardt and Young (1990) and Kim et al. (1994) that for some ripple
fired explosions time independent spectral modulations may or may not exist,
and that if they do exist, they need not be consistent among different
explosions, even if those explosions originate from the same mine or quarry.
Irregular source delays have been noted elsewhere (e.g., Richards et al.,
1991). As our results imply, the inability of time independent modulations
to discriminate between earthquakes and explosions may not necessarily
be the exception. Low frequency path independent modulations advocated
by Gitterman and van Eck (1993) also can be inconclusive for discrimination
purposes, possibly as a result of the spatial-temporal layout of the explosion,
the earthquake mechanism's radiation pattern, or disproportionate phase
attenuation. We found that the travel path through the Middle-High Atlas
junction significantly attenuates shear waves (in our case, Sg) with respect
to the compressional waves. This observation agrees with, for example,
the Kim et al. (1994) finding that Lg propagation was disrupted when significant
structural variations were encountered, such as in their case the Appalachian
platform in southern New York-New Jersey. We also found that in the low
frequencies, earthquakes often seemed to demonstrate path independent spectral
modulation similar to that of ripple fired explosions; at higher frequencies,
the scalloping from ripple fired explosions was often incoherent among
recording stations. As in the case of time independent modulations, path
independent modulations might exist for a significant portion of the ripple
fired explosion recordings, but they might not be conclusive enough in
comparison to earthquake power spectrum data to use consistently and reliably
as a discriminant. Our attempts to discriminate between earthquakes and
explosions using spectral ratios confirm several findings in the literature.
As noted by Baumgardt and Young (1990), for separating ripple fired explosions
from earthquakes the P/S spectral discriminants seem to perform considerably
better than spectral discriminants within the same phase. This directly
contrasts with efforts to discriminate between nuclear explosions and earthquakes
in the Western United States (Bennett and Murphy, 1986). The Walter et
al. (1995) analysis suggests that this difference is not due to differences
in source mechanism or tectonic paths, but to the source medium. We, however,
observed that path propagation will make a significant difference in the
discriminant's value. For example, the TNF station recordings usually had
the highest Pg/Sg values. This dependency on propagation path agrees with
the findings of Lynnes and Baumstark (1991) for P/S discriminants for Nevada
Test Site explosions. Also in agreement with Richards et al. (1991) and
Blandford (1995) our highest frequency P/S discriminant was our most successful
ratio test. Finally, as Wuster (1993) has emphasized, empirical discriminants
are fundamentally limited by their training sets. No doubt, this caveat
is especially applicable for our relatively small data set. This study
applied many of the standard methods for discriminating between earthquakes
and ripple fired explosions to a new geologic setting, northwest Morocco,
in an effort to examine the limitations of these techniques. We found that
although time and path independent spectral modulations can be useful,
they are far from ubiquitous. Source mechanisms for explosions may vary
substantially even among events from the same quarry or mine. Furthermore,
crustal structure determines the character of the seismic signal to a greater
extent than the source mechanism. Despite the susceptibility of spectral
discriminant values for a given event to propagation effects, we were able
to construct a discrimination technique that could systematically discriminate
the events in our data set. The training set, however, imposes fundamental
constraints, especially since nuclear explosions are not constituent of
that data set. Since the source and path effects noted in this study are
likely to play a role in all efforts to seismically discriminate among
nuclear explosions, chemical explosions, and earthquakes, databases that
organize regional geological, geophysical, seismological, and crustal information
are critical components to the success of any seismic CTBT verification
project. By recognizing the complexity of seismic discrimination, our study
emphasizes that the regional case-based approach which has shown much promise
requires nothing less than the best empirical information.
3.2. Upper Crustal Seismic Velocity Structure in Eastern
Syria
3.2.1 Introduction
We present the interpretation of seismic refraction data collected along
a north-south profile across the Euphrates depression and other zones of
structural interest in eastern 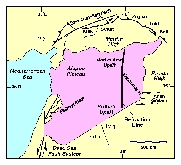 Syria
(Figure 28). The results from refraction data
are refined and supported by additional information from well logs, seismic
reflection, and gravity data. The interpretation of these data is used to
establish metamorphic basement depth in eastern Syria. This, along with
indications of basement and deep sedimentary structure in the area, can
help to better understand regional wave propagation and to better locate
and calibrate regional events. Eastern Syria is situated at the northern
end of the Arabian platform which is believed to be accreted from several discrete
continental blocks during the Proterozoic (e.g. Pallister et al., 1987;
Stoesser & Camp, 1985). Suture zones corresponding to this accretion
have been documented in the Arabian shield where basement rocks are exposed
(Stoesser & Camp, 1985). Although it is reasonable to suppose that similar
sutures exist in the northern part of the Arabian platform (Barazangi et
al., 1993; Best et al., 1990; Best et al., 1993), their location is difficult
to ascertain because of thick sedimentary cover across much of the region.
It has been suggested that the major present-day structural features of
Syria are products of reactivation along these sutures which act as zones
of weakness in the platform (Best et al., 1993; Litak et al., 1996a; Stoesser
& Camp, 1985). Although an appreciable amount of research has been
conducted in the Palmyride mountains of western Syria (e.g. Al-Saad et
al., 1992; Barazangi et al., 1992; Chaimov et al., 1990, 1992), relatively
little work has focused on eastern Syria. In particular, the Euphrates
depression has received limited attention in comparison to its geologic
and economic importance (de Ruiter et al., 1994; Lovelock, 1984). Recent
work (Alsdorf et al., 1995; Litak et al., 1996a; Litak et al., 1996b; Sawaf
et al., 1993) has increased understanding of the Euphrates system but detailed
assessment of basement structure and depth in eastern Syria has hitherto
been unavailable. The lack of constraints on basement depths in Syria is
a consequence of an almost complete absence of basement outcrops and well
penetration. Leonov et al. (1989) constructed a depth to basement map within
Syria and established the broad trends which are still generally accepted
although new results presented herein disagree somewhat with this earlier
assessment. Seber et al. (1993) used refraction data to establish basement
depths in western Syria and determined seismic velocity of the basement
to be ~6 km/s. However, the lack of previous investigations in eastern
Syria means that the results presented here significantly further current
knowledge.
Syria
(Figure 28). The results from refraction data
are refined and supported by additional information from well logs, seismic
reflection, and gravity data. The interpretation of these data is used to
establish metamorphic basement depth in eastern Syria. This, along with
indications of basement and deep sedimentary structure in the area, can
help to better understand regional wave propagation and to better locate
and calibrate regional events. Eastern Syria is situated at the northern
end of the Arabian platform which is believed to be accreted from several discrete
continental blocks during the Proterozoic (e.g. Pallister et al., 1987;
Stoesser & Camp, 1985). Suture zones corresponding to this accretion
have been documented in the Arabian shield where basement rocks are exposed
(Stoesser & Camp, 1985). Although it is reasonable to suppose that similar
sutures exist in the northern part of the Arabian platform (Barazangi et
al., 1993; Best et al., 1990; Best et al., 1993), their location is difficult
to ascertain because of thick sedimentary cover across much of the region.
It has been suggested that the major present-day structural features of
Syria are products of reactivation along these sutures which act as zones
of weakness in the platform (Best et al., 1993; Litak et al., 1996a; Stoesser
& Camp, 1985). Although an appreciable amount of research has been
conducted in the Palmyride mountains of western Syria (e.g. Al-Saad et
al., 1992; Barazangi et al., 1992; Chaimov et al., 1990, 1992), relatively
little work has focused on eastern Syria. In particular, the Euphrates
depression has received limited attention in comparison to its geologic
and economic importance (de Ruiter et al., 1994; Lovelock, 1984). Recent
work (Alsdorf et al., 1995; Litak et al., 1996a; Litak et al., 1996b; Sawaf
et al., 1993) has increased understanding of the Euphrates system but detailed
assessment of basement structure and depth in eastern Syria has hitherto
been unavailable. The lack of constraints on basement depths in Syria is
a consequence of an almost complete absence of basement outcrops and well
penetration. Leonov et al. (1989) constructed a depth to basement map within
Syria and established the broad trends which are still generally accepted
although new results presented herein disagree somewhat with this earlier
assessment. Seber et al. (1993) used refraction data to establish basement
depths in western Syria and determined seismic velocity of the basement
to be ~6 km/s. However, the lack of previous investigations in eastern
Syria means that the results presented here significantly further current
knowledge.
3.2.2 Method
The model of basement depth and deep sedimentary structure developed
herein relies on the analysis of several data sources, particularly a high
density seismic refraction line. The refraction data was collected as part
of a larger seismic profiling effort spanning all of Syria conducted in
1972-3 (Ouglanov et al., 1974). Figure 28 shows
the exact location of the refraction line which is 302.2 km long oriented
essentially north-south. In total data from 23 shots, each with forward
and reverse geophone spreads, are used here yielding a fold of coverage
of at least 700% in most places. After digitization of first arrivals from
the original records, the refraction data were interpreted using a ray-tracing
approach utilizing the software of Luetgert (1992). In an initial interpretation
the positions and velocities of various user-defined layers in the software
were subtly altered until travel times of calculated raypaths through
the computer model matched those of the digitized observed arrival times.
Although this approach naturally produced a model in agreement with the
refraction data, the velocity interfaces in this model were found to be
in disagreement with velocity boundaries observed in sonic logs and two-way
travel times from seismic reflection data. The disagreement was largely
a consequence of the limitations in the refraction method, in particular
the inability to detect low-velocity layers which are clearly demonstrated
by the sonic logs. However, the ambiguity of low-velocity layers can be
eliminated if velocity information and/or reflection times are available
from an independent source. Therefore, an interpretation strategy was adopted
in which the refraction, reflection and well data were used simultaneously
in the refinement of the velocity model, thus establishing a model consistent
with all available data. An initial model, based on reflection profiles
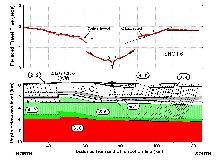 and sonic logs, was refined through ray-tracing to improve agreement with
the refraction data (Figure 29), with particular
attention to ensure compatibility with the other data sets. Correlations
using sonic logs and seismic reflection data were used to guide modeling
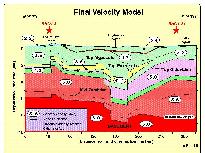
of the refraction data. The modeling effort culminated in the 'final velocity
model' (Figure 30) which satisfactorily fitted
all the available data. Velocities from sonic logs agreed with those in
the model. Two-way reflection times to certain interfaces in the model
corresponded to two-way times in numerous intersecting seismic reflection
profiles. Observed gravity data (not shown here) were compared to the gravity
signature of the refraction model with each velocity layer assigned a density
and the analysis showed broad agreement between the two profiles. Above
all, the calculated refraction arrivals agree to within acceptable limits
with the measured arrival times. Figure 30 shows
that velocities generally increase with depth in the model (as found in
the refraction modeling of Seber et al. (1993). However, some low-velocity
channels are observed which are thought to be controlled by lithology.
For example, the upper Paleozoic strata, which are predominately shales
and sandy shales represent a low-velocity layer when compared to the overlying
Triassic dolomites and anhydrites. Such low-velocity layers would not have
been detected by the refraction data alone. Only through the use of independent
sources of velocity data, such as the sonic logs and reflection data can
these low-velocity zones be identified. Despite direct evidence for the
majority of the model, a few uncertainties remain. Some of the low-velocity
layers are not detected by the refraction method, are not penetrated by
and sonic logs, was refined through ray-tracing to improve agreement with
the refraction data (Figure 29), with particular
attention to ensure compatibility with the other data sets. Correlations
using sonic logs and seismic reflection data were used to guide modeling
of the refraction data. The modeling effort culminated in the 'final velocity
model' (Figure 30) which satisfactorily fitted
all the available data. Velocities from sonic logs agreed with those in
the model. Two-way reflection times to certain interfaces in the model
corresponded to two-way times in numerous intersecting seismic reflection
profiles. Observed gravity data (not shown here) were compared to the gravity
signature of the refraction model with each velocity layer assigned a density
and the analysis showed broad agreement between the two profiles. Above
all, the calculated refraction arrivals agree to within acceptable limits
with the measured arrival times. Figure 30 shows
that velocities generally increase with depth in the model (as found in
the refraction modeling of Seber et al. (1993). However, some low-velocity
channels are observed which are thought to be controlled by lithology.
For example, the upper Paleozoic strata, which are predominately shales
and sandy shales represent a low-velocity layer when compared to the overlying
Triassic dolomites and anhydrites. Such low-velocity layers would not have
been detected by the refraction data alone. Only through the use of independent
sources of velocity data, such as the sonic logs and reflection data can
these low-velocity zones be identified. Despite direct evidence for the
majority of the model, a few uncertainties remain. Some of the low-velocity
layers are not detected by the refraction method, are not penetrated by
 wells, and are not located unambiguously by seismic reflection data. Thus,
positions of parts of these layers are uncertain and shown in the figures
with dashed lines. It is also not possible to get exact measures of the
velocities of the low-velocity zones in some of these cases and so velocities
have been given which are interpolations between known data. Additionally,
the depth to basement in the far south of the model is only believed to
be a minimum constraint. No refractions where observed in this part of
the refraction line at velocities considered typical of those for basement
rocks. It is believed this is because geophone spreads were too short to
detect refractions from this depth, therefore the depth to basement shown
is a minimum (Figure 30). However, the majority
of the final velocity model is based on direct evidence and the errors
in the bulk of the model can be shown to be relatively small, with approximately
▒200 m error on depth to most interfaces and ▒0.1 km/s in velocities.
wells, and are not located unambiguously by seismic reflection data. Thus,
positions of parts of these layers are uncertain and shown in the figures
with dashed lines. It is also not possible to get exact measures of the
velocities of the low-velocity zones in some of these cases and so velocities
have been given which are interpolations between known data. Additionally,
the depth to basement in the far south of the model is only believed to
be a minimum constraint. No refractions where observed in this part of
the refraction line at velocities considered typical of those for basement
rocks. It is believed this is because geophone spreads were too short to
detect refractions from this depth, therefore the depth to basement shown
is a minimum (Figure 30). However, the majority
of the final velocity model is based on direct evidence and the errors
in the bulk of the model can be shown to be relatively small, with approximately
▒200 m error on depth to most interfaces and ▒0.1 km/s in velocities.
3.2.3 Conclusions
Basement depth beneath eastern Syria is found to be greater than previously
supposed. In the south across the Rutbah uplift the basement is at least
8.5 km deep, in the Euphrates depression it is around 9 km, and to the
north of the Euphrates basement is at about 6 km (Figure 30). Velocities
of sedimentary formations are found to increase with depth and age although
some low-velocity layers controlled by lithology are documented. The identification
of these low-velocity zones would not be possible using the refraction
data alone and only through the integrated use of several data sources
can the low-velocity channels be unambiguously detected. Deeply penetrating
faults are identified in the Euphrates graben demonstrating the thick-skinned
tectonic style of this region. Clearly different trends in basement depth
on the northern and southern sides of the Euphrates graben could be further
evidence for the Proterozoic accretion of the northern Arabian platform
with the Euphrates system as a suture zone. Our results significantly contribute
to any modeling efforts to understand regional wave propagation in this
critical area of the Middle East. Moreover, our accurate velocity determinations
will improve event locations and calibrations.
3.3 Receiver Function Inversion in the Middle East
and North Africa
3.3.1 Introduction
In the Middle East and North Africa there is only a very sparse coverage
of three-component broadband stations; therefore, we are limited in the
types of seismological investigations we can employ. Hence, in order to
obtain some idea of the velocity structure in this region we have used
data from these stations to compile receiver functions, a single station
method, for all broadband stations in the Middle East and North Africa.
By inverting these receiver functions we hope to place some constraints
on Moho depths and average shear-wave velocities in regions where previously
there has been very little information on crustal velocities and thicknesses.
We have chosen to invert only for first-order features in the crust and
upper mantle in order to avoid over-interpreting our receiver function
data.
3.3.2 Data
We have collected over 600 Megabytes of broadband, three-component teleseismic
waveform data from IRIS, MEDNET, GEOSCOPE and GEOFON broadband stations
in the Middle East and North Africa (Figure 31). We have examined all of
these records for good signal to noise ratios and eliminated those with
signal to noise ratios of less than 5 to 1. We have also attempted to eliminate
the effects of large scale lateral velocity heterogeneity by calculating
the radial direction using the first motion of the teleseismic P-wave waveform.
We have minimized the "corrected" tangential component and then
rotated the horizontal components into these corrected radial and tangential
directions. Although this procedure will not remove the effect of smaller
scale crustal and upper mantle heterogeneity we have found that it does
remove the effect of large scale mantle heterogeneity that can cause the
teleseismic P-wave ray-paths to bend outside the great circle path. We
have employed the standard "water level" spectral division technique
(e.g., Langston, 1979, Ammon et al., 1990) to calculate each of the receiver
functions used in this study. In order to solve for receiver functions
that are sensitive primarily to first-order features, we have used a gaussian
filter with an a = 1.5. This filter produced receiver functions that contained
data with frequencies of .5 Hz and lower. From the 24 stations that we
have collected data for, we have been able to calculate high quality receiver
function waveforms for 12 stations (Figure 31).
3.3.3 Inversion Method
In order to invert the receiver function data for crustal and uppermost
mantle shear-wave velocity structure we employed a grid search scheme using
a maximum of six layers in our model. For simple receiver functions we
used a one-layer crustal model (see stations BNG and DBIC in Figure
31) and still obtained a reasonable fit. The advantage of our grid
search scheme, unlike other techniques, is the guarantee that we will solve
only for global minima. We have used a grid spacing for the shear-wave
velocities of 0.1 km/sec and a grid spacing for layer thicknesses of typically
2 km, and in some cases, 1 km for the first layer thickness. It is doubtful
that with the approximations we have made, the receiver function inversion
will be able to resolve model fluctuations smaller than these grid spacings.
By using only 10 model parameters ( 5 layers where we vary both the layer
thickness and shear-wave velocity) in our inversion, the receiver function
inversion's non-uniqueness problem is reduced. The longer period receiver
functions are fit reasonably well by a 5 layer 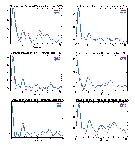 model
(Figure 32). We also have been able to invert
for a bulk Poisson's ratio for stations which require only 4 or fewer layers
to model the receiver function waveforms. For example, at stations DBIC
and BNG we have solved for a bulk Poisson's ratio of 0.25. The grid search
scheme allows us to map the RMS error surface.
model
(Figure 32). We also have been able to invert
for a bulk Poisson's ratio for stations which require only 4 or fewer layers
to model the receiver function waveforms. For example, at stations DBIC
and BNG we have solved for a bulk Poisson's ratio of 0.25. The grid search
scheme allows us to map the RMS error surface.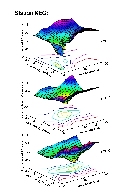 This allows us to examine for the possibility of non-uniqueness in our
inversions. If multiple minima exist within our error surface, then our
inversion results are non-unique. Figure 33
is a portion of the 9-dimensional error surface for station KEG in which
we do not see evidence for large local minima which are located far from
the global minima. However, this is only a portion of error surface from
the grid search inversion. We are currently working a method in which we
can estimate the noise contained within the receiver function which would
then allow us to solve for a confidence region from our error surface.
We have found that comparisons between the grid search technique and the
linearized least squares (LLS) method yield significantly different results
if one does not consider the non-uniqueness of the LLS technique. For those
receiver functions that are relatively simple in nature (i.e., only a P-to-S
conversion at the Moho) then the results are similar. Figure
34 is an example of the difference given between these two methods.
We have employed Ammon's et al. (1990) method of using multiple starting
models (Figure 34).
This allows us to examine for the possibility of non-uniqueness in our
inversions. If multiple minima exist within our error surface, then our
inversion results are non-unique. Figure 33
is a portion of the 9-dimensional error surface for station KEG in which
we do not see evidence for large local minima which are located far from
the global minima. However, this is only a portion of error surface from
the grid search inversion. We are currently working a method in which we
can estimate the noise contained within the receiver function which would
then allow us to solve for a confidence region from our error surface.
We have found that comparisons between the grid search technique and the
linearized least squares (LLS) method yield significantly different results
if one does not consider the non-uniqueness of the LLS technique. For those
receiver functions that are relatively simple in nature (i.e., only a P-to-S
conversion at the Moho) then the results are similar. Figure
34 is an example of the difference given between these two methods.
We have employed Ammon's et al. (1990) method of using multiple starting
models (Figure 34).
3.3.4 Results
Crustal thickness in North Africa is found to be generally on the order
of 38 to 41 km (see Figure 31), except station
ATD which is located on exposed oceanic crust. We have found a Moho depth
of 8 km for station ATD which is consistent with an oceanic crust. Data
from three coastal stations in North Africa (MBO, TBT, and MEB) contain
evidence of very strong lateral heterogeneity and teleseismic P-wave multi-pathing.
In the Middle East, our estimated crustal and basement thicknesses compare
well with the available seismic refraction profile interpretations. There
is some ambiguity in where to interpret the Moho for station KEG's shear-wave
velocity model. There are two relatively large velocity discontinuities:
one at 30 km (3.5 km/s to 4.0 km/s) and the other at 40 km (4.0 km/s to
4.5 km/s). Makris et al. (1987) report crustal thicknesses on the order
of 30 km (30 to 34 km) which would correspond to the first velocity discontinuity
that we observed in our model. For other stations in North Africa we have
found that the crust is usually on the order of 40 km thick. However, in
the Moroccan Middle Atlas we do find a crustal thickness of 35 km. We have
also found evidence of a pronounced mid-crustal low-velocity zone in central
Turkey beneath station ANTO. There has been no prior indication of a low
velocity zone in this region although this is a region where the mantle
lid is slow and highly attenuating. It is not clear whether this low-velocity
zone is related to the heating of the middle crust, some rheological change
within the crust or due to 2-dimensional lateral velocity heterogeneity
affecting our 1-dimensional model. We have found a Moho depth of 30 km
beneath station BGIO which is located near the Dead Sea fault. This crustal
thickness is consistent with a refraction profile that was run parallel
to the Dead Sea fault (Makris et. al., 1989). The thickest crust, approximately
55 km, was found beneath station GNI in the Caucasus Mountains. However,
data at station GNI are of relatively low quality and contains a fair amount
of noise within the stacked receiver function. Also, at station GNI we
have observed a large amount of coherent and azimuthally dependent energy
which appears on the tangential receiver functions which is an indication
of a dipping Moho as well as dipping interfaces within the middle crust.
The above results are currently being used and integrated with other available
information to produce an accurate gridded Moho map for the Middle East
region.
4. REFERENCES
Al-Saad, D., Sawaf, T., Gebran, A., Barazangi, M., Best, J. and Chaimov,
T., 1992. Crustal structure of central Syria: The intracontinental Palmyride
mountain belt, Tectonophysics, 207, 345-358.
Alsdorf, D., Barazangi, M., Litak, R., Seber, D., Sawaf, T. and Al-Sadd,
D., 1995. The intraplate Euphrates depression-Palmyrides mountain belt
junction and relationship to Arabian plate boundary tectonics, Annali Di
Geofisica, 38, 385- 397.
Ammon, C.L, Randall G. E., and Zandt, G., 1990. On the Nonuniqueness
of Receiver Functions, Journ. Geophys. Res., 95, 15,303-15,318.
Barazangi, M., Seber, D., Al-Saad, D. and Sawaf, T., 1992. Structure
of the intracontinental Palmyride mountain belt in Syria and its relationship
to nearby Arabian plate boundaries, Bulletin of Earth Sciences, Cukurova
University, Adana, Turkey, 20, 111-118.
Barazangi, M., Seber, D., Chaimov, T., Best, J., Litak, R., Al-Saad,
D. and Sawaf, T. Tectonic evolution of the northern Arabian plate in western
Syria. In Recent evolution and Seismicity of the Mediterranean Region,
edited by E. Boschi and et al, 117-140. Netherlands: Kluwer Academic Publishers
1993.
Baumgardt, D.R. and Ziegler, K.A., 1988. Spectral evidence for source
multiplicity in explosions: application to regional discrimination of earthquakes
and explosions, Bull. Seism. Soc. Am. 78, 1773-1795.
Baumgardt, D.R. and G.B. Young, 1990. Regional seismic waveform discriminants
and case-based event discrimination using regional arrays, Bull. Seism.
Soc. Am. 80, 1874-1892.
Bennett, T.J. and J.R. Murphy 1986. Analysis of seismic discrimination
capabilities using regional data from western United States events, Bull.
Seism. Soc. Am. 76, 1069-1086.
Best, J. A., Barazangi, M., Al-Saad, D., Sawaf, T. and Gebran, A., 1990.
Bouguer gravity trends and crustal structure of the Palmyride Mountain
belt and surrounding northern Arabian platform in Syria, Geology, 18, 1235-1239.
Best, J. A., Barazangi, M., Al-Saad, D., Sawaf, T. and Gebran, A., 1993.
Continental margin evolution of the northern Arabian platform in Syria,
American Association of Petroleum Geologists Bulletin, 77, 173-193.
Blandford, R.R., 1995. Discrimination of mining, cratering, tamped,
and decoupled explosions using high frequency S-to-P ratios, AFTAC-TR-95-002,
Patrick AFB, Florida, 34 pp.
Chaimov, T., Barazangi, M., Al-Saad, D., Sawaf, T. and Gebran, A., 1990.
Crustal shortening in the Palmyride fold belt, Syria, and implications
for movement along the Dead Sea fault system, Tectonics, 9, 1369-1386.
de Ruiter, R. S. C., Lovelock, P. E. R. and Nabulsi, N. The Euphrates
Graben, Eastern Syria: A New Petroleum Province in the Northern Middle
East. In Geo '94, Middle East Petroleum Geosciences, edited by Moujahed
Al-Husseini, 357-368. Manama, Bahrain: Gulf PetroLink 1994.
Elvers, E., 1974. Seismic event identification by negative evidence,
Bull. Seism. Soc. Am. 64, 1671-1683.
Gitterman, Y. and T. van Eck, 1993. Spectra of quarry blasts and microearthquakes
recorded at local distances in Israel, Bull. Seism. Soc. Am. 93, 1799-1812.
Jacobshagen, V., K. Gorler, and P. Giese, 1988. Geodynamic evolution
of the Atlas System (Morocco) in Post-Palaeozoic time, in The Atlas System
of Morocco, Jacobshagen (Editor), Lecture Notes in Earth Sciences, 15,
Springer-Verlag, Berlin, 481-499.
Kim, W.Y., D.W. Simpson, and P.G. Richards, 1994. High-frequency spectra
of regional phases from earthquakes and chemical explosions, Bull. Seism.
Soc. Am. 84, 1365-1386.
Langston, C. A., 1979. Structure under Mount Rainer, Washington inferred
from teleseismic body waves, J. Geophys. Res., 84, 4749-4762.
Leonov, Y. G., Sigachev, S. P., Otri, M., Yusef, A., Zaza, T. and Sawaf,
T., 1989. New data on the Paleozoic complex of the platform cover of Syria,
Geotectonics, 23, 538-542.
Litak, R. K., Barazangi, M., Beauchamp, W. and Seber, D., 1996a. Mesozoic-Cenozoic
Evolution of the Euphrates Fault System, Syria: Implications for Regional
Kinematics (Submitted to Geological Society London Journal).
Litak, R. K., Barazangi, M., Sawaf, T., Al-Iman, A. and Al-Youssef,
W., 1996b. Structure and Evolution of the Petroliferous Euphrates Graben
System, Southeast Syria, (Submitted to American Association Of Petroleum
Geologist Bulletin),.
Lovelock, P. E. R., 1984. A review of the tectonics of the northern
Middle East region, Geological Magazine, 121, 577-587.
Luetgert, J. H., 1992. Interactive Two-Dimensional Seismic Raytracing
for the Macintosh_, US Geol. Sur., Open File Report 92-356, Menlo Park,
California
Lynnes, C. and R. Baumstark, 1991. Phase and spectral ratio discrimination
in North America, Teledyne Technical Report TGAL-91-06.
Makris, J., A. Demnati, and J. Klussmann, 1985. Deep seismic soundings
in Morocco and a crust and upper mantle model deduced from seismic and
gravity data, Annales Geophyicae 3, 369-380.
Makris, J., Rihm, R., and Allam, A., 1987. Some geophysical aspects
of the evolution and structure of the crust in Egypt, in, El-Gaby, S.,
and R.O. Greilings (Eds.) The Pan-African Belt of Northeast Africa and
Adjacent Areas, Friedr. Vieweg & Sohn, Braunshweig, p. 345-369.
Ouglanov, V., Tatlybayev, M. and Nutrobkin, V., 1974. Report on seismic
profiling in the Syrian Arab Republic, (Unpublished), General Petroluem
Company Report, Aleppo, Syria, pp. 73
Pallister, J. S., Stacey, J. S., Fischer, L. B. and Premo, W. R., 1987.
Arabian shield ophiolites and late Proterozoic microplate accretion, Geology,
15, 320-323.
Pomeroy, P.W., W.J. Best, and T.V. McEvilly, 1982. Test ban treaty verification
with regional data--a review, Bull. Seismo. Soc. Am. 72, S89-S129.
Richards, P.G., W.Y. Kim, D.W. Simpson, and G. Ekstrom, 1991. Chemical
explosions and the discrimination problem, PL-TR-91-2285, Phillips Lab.,
Hanscom AFB, Massachusetts, 96 pp.
Sawaf, T., Al-Saad, D., Gebran, A., Barazangi, M., Best, J. A. and Chaimov,
T., 1993. Structure and stratigraphy of eastern Syria across the Euphrates
depression, Tectonophysics, 220, 267-281.
Seber, D., Barazangi, M., Chaimov, T., Al-Saad, D., Sawaf, T. and Khaddour,
M., 1993. Upper crustal velocity structure and basement morphology beneath
the intracontinental Palmyride fold-thrust belt and north Arabian platform
in Syria, Geophysical Journal International, 113, 752-766.
Smith, A.T., 1989. High-frequency seismic observations and models of
chemical explosions: implications for the discrimination of ripple-fired
mining blasts, Bull. Seism. Soc. Am. 79, 1089-1110.
Stoesser, D. B. and Camp, V. E., 1985. Pan-African microplate accretion
of the Arabian shield, Geological Society of America Bulletin, 96, 817-826.
Smith, A.T., 1993. Discrimination of explosions from simultaneous mining
blasts, Bull. Seism. Soc. Am. 83, 160-179.
Taylor, S.R., M.D. Denny, E.S. Vergino, and R.E. Glaser, 1989. Regional
discrimination between NTS explosions and western U.S. earthquakes, Bull.
Seism. Soc. Am. 78, 1563-1579.
Walter, W.R., K.M. Mayeda, and H.J. Patton 1995. Phase and spectral
ratio discrimination between NTS earthquakes and explosions. Part I: empirical
observations, Bull. Seism. Soc. Am. 85, 1050-1067.
Wigger, P., G. Asch, P. Giese, W. Heinsohn, S. El Alami, and F. Ramdani
1992. Crustal structure along a traverse across the Middle and High Atlas
mountains derived from seismic refraction studies, Geol. Rundschau. 70,
801- 841.
Wuster, J., 1993. Discrimination of chemical explosions and earthquakes
in Central Europe--a case study, Bull. Seism. Soc. Am. 83, 1184-1212.
Woodward, W.A. and H.L. Gray, 1995. A Hypothesis -Testing Approach to
Outlier Detection, PL-TR-95.2141, Phillips Lab., Hanscom AFB, Massachusetts,
pp. 115.
APPENDIX I: LIST OF AVAILABLE
DATA SETS
Geographic data sets:
Coast lines
Country borders
Rivers
Lakes
Main roads
Main city locations
Geophysical data sets:
PDE seismicity catalogue
ISC seismic catalogue
CMT event locations and focal mechanisms
Short period seismic stations locations
Broad band seismic station locations
Crustal scale seismic and gravity profiles and their interpretations
Bouguer and Free air gravity maps
Moho depth map of Middle East and North Africa
Basement depth map of Middle East and North Africa Geological data sets:
Complete tectonic map of the Middle East
Mine locations in the Middle East and North Africa Images:
A complete coverage of TMĀLandsat imagery of the Dead sea fault system
in the Middle East
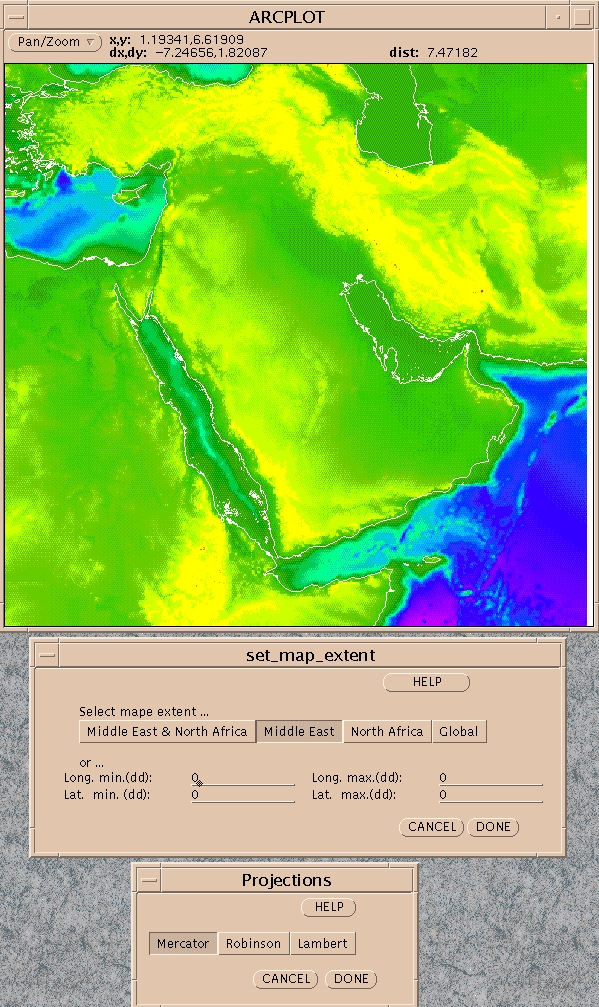
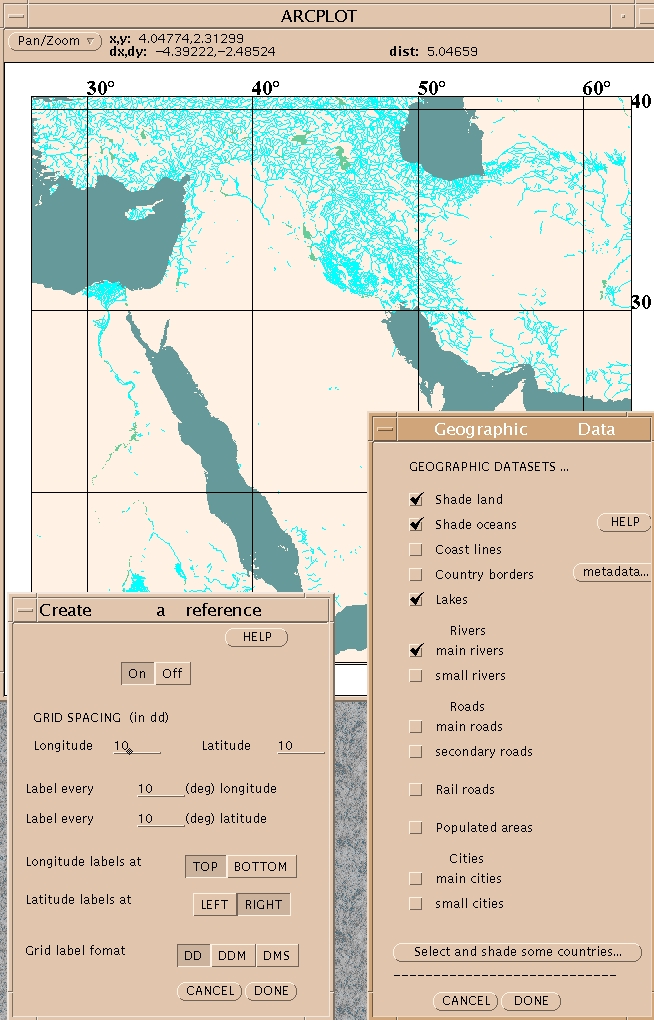
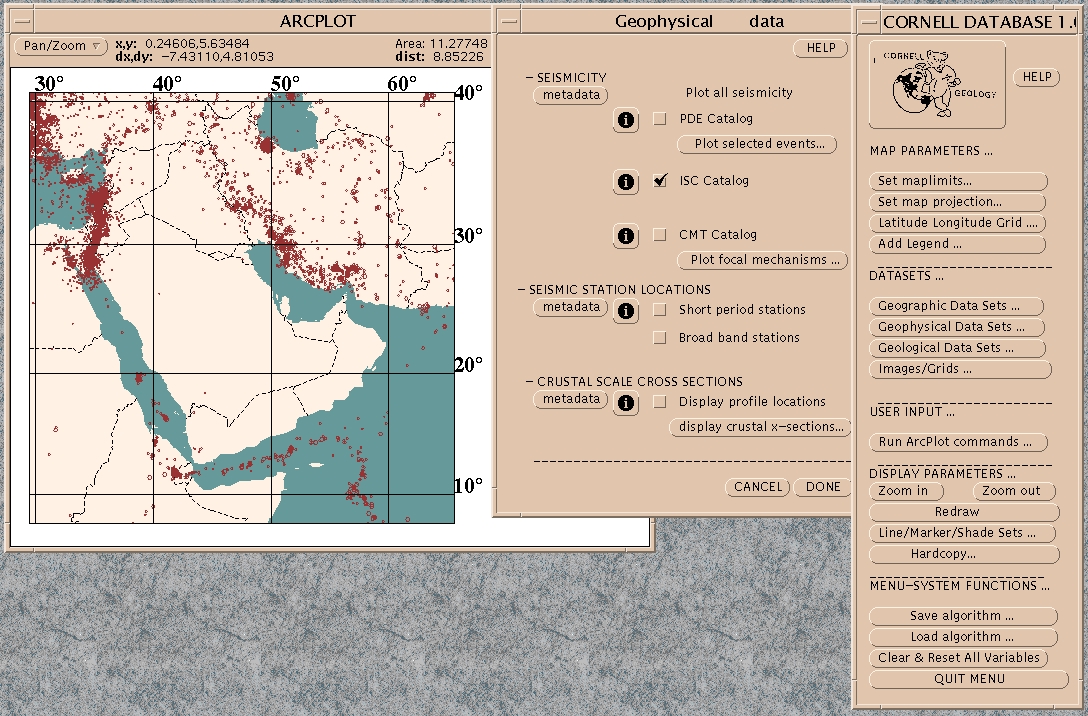
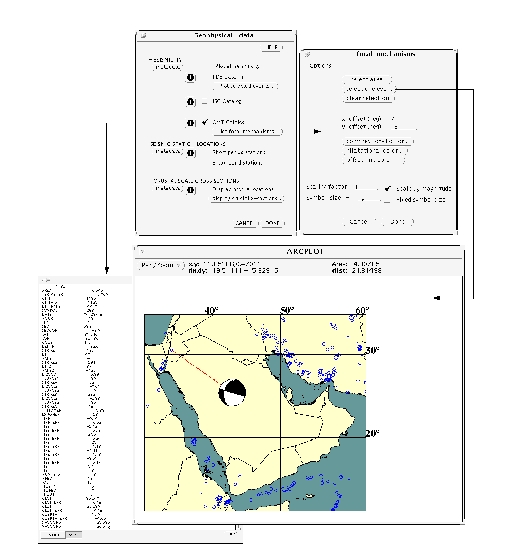
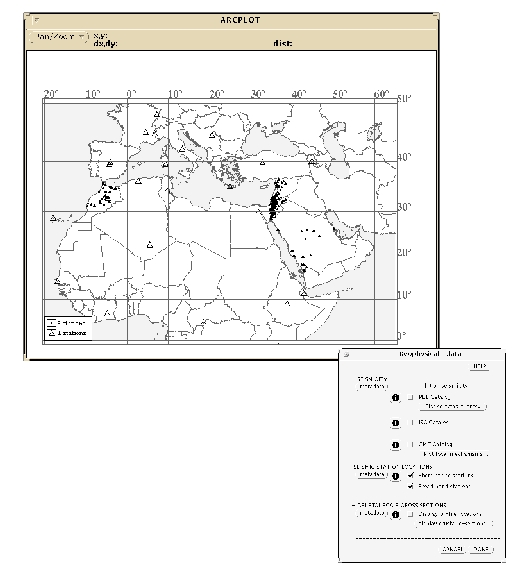
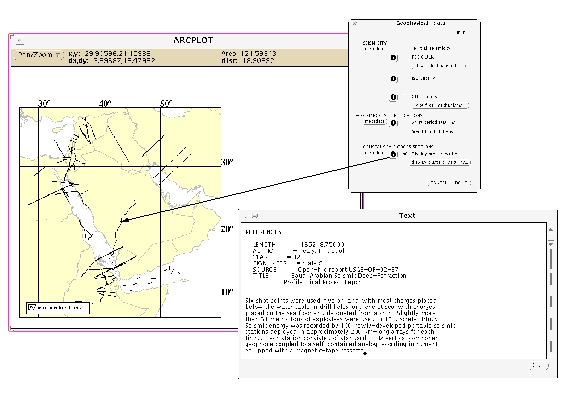
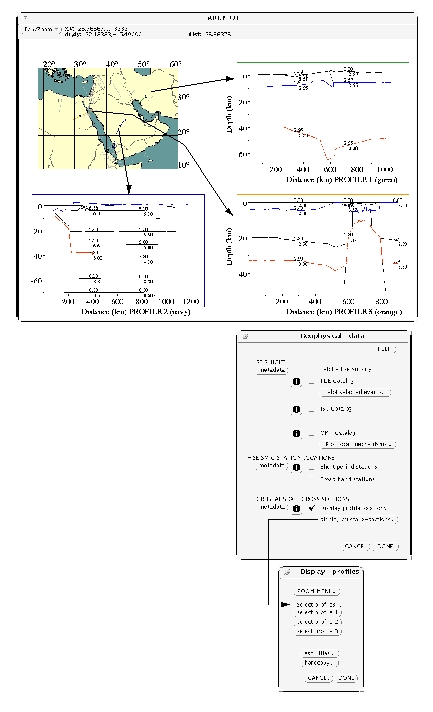
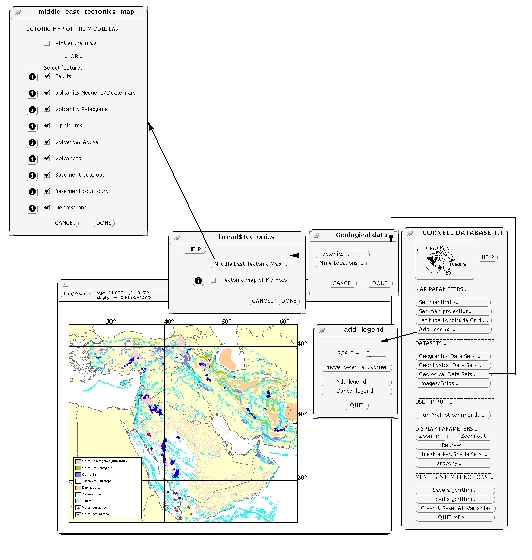
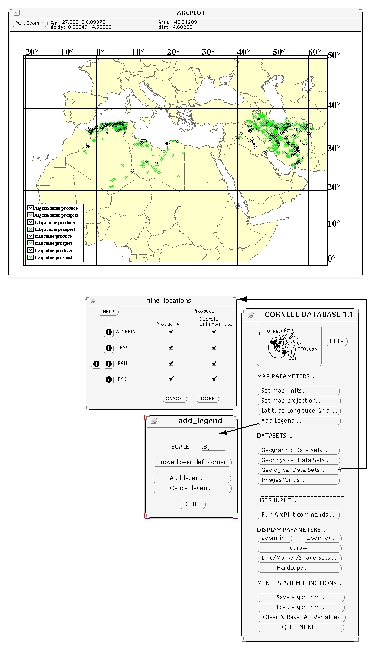
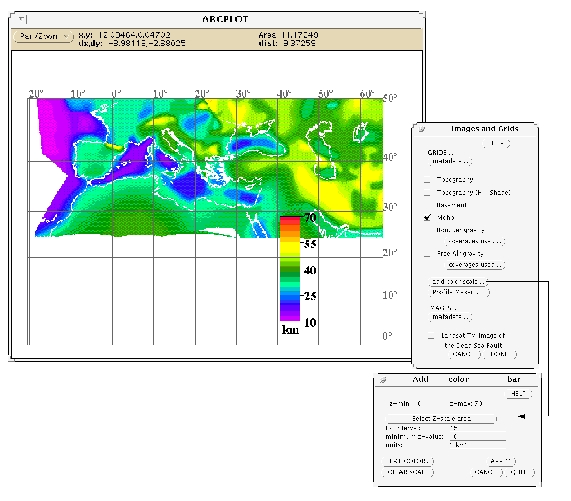
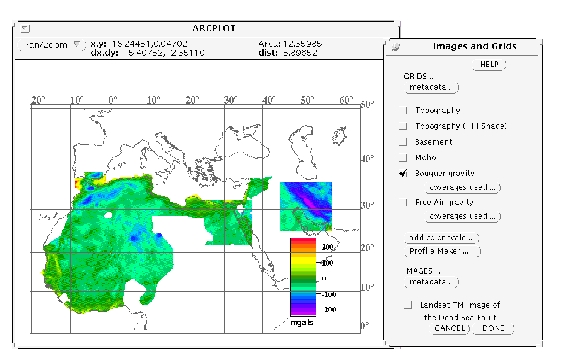
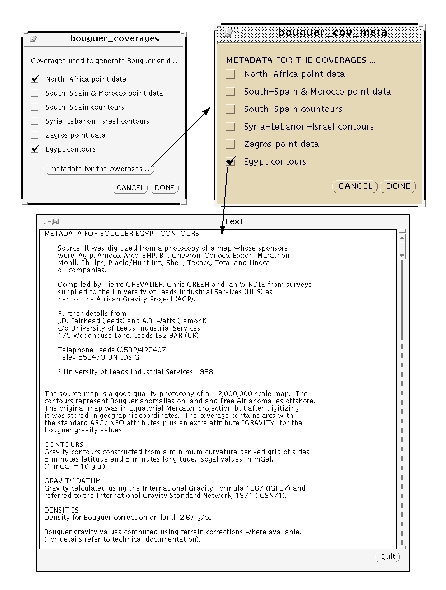
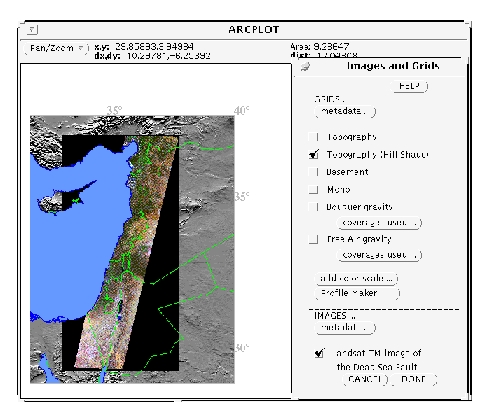
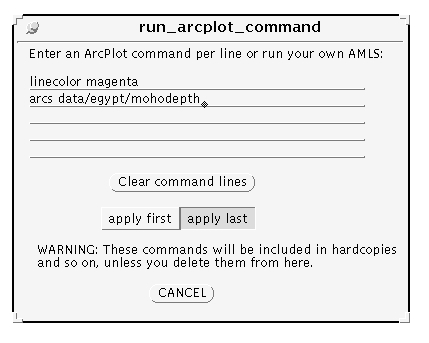
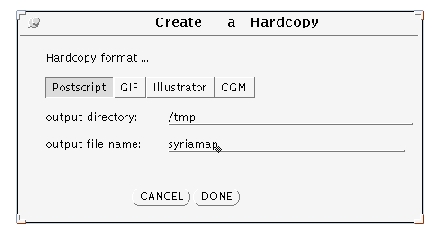
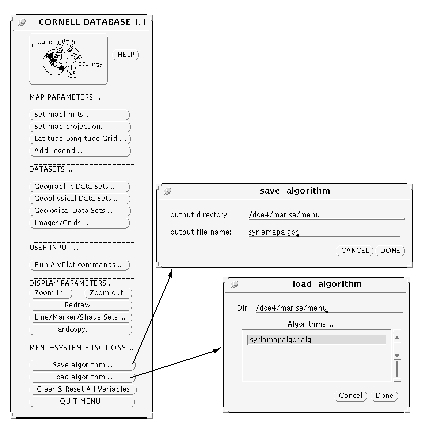
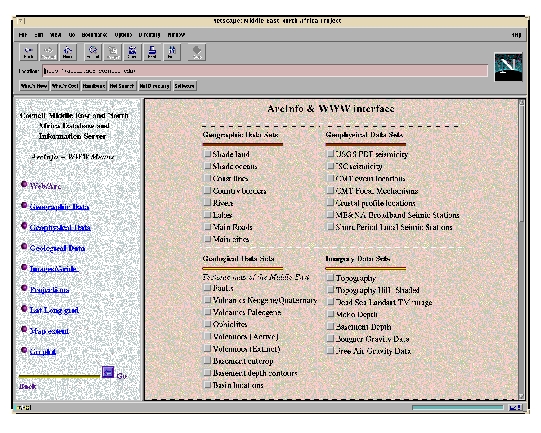
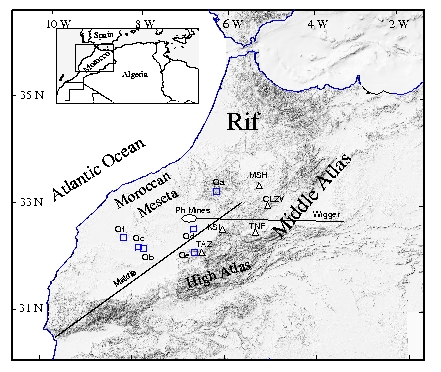
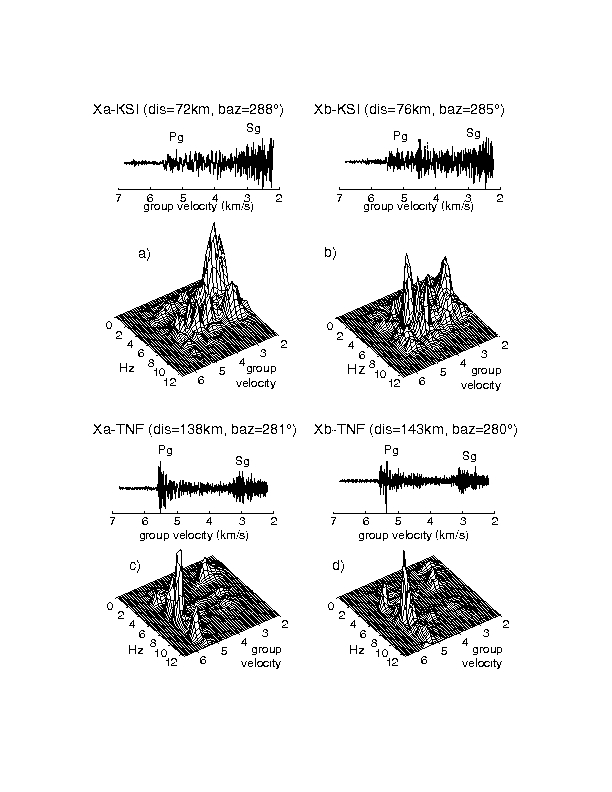
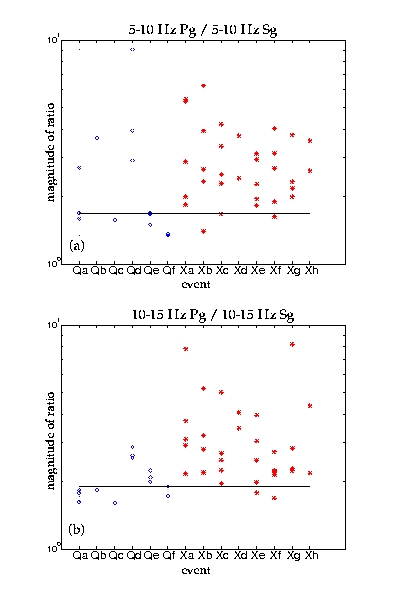
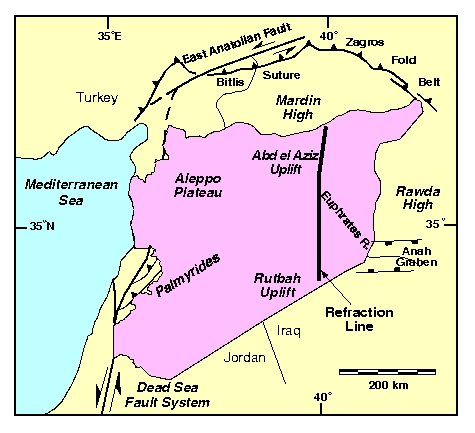
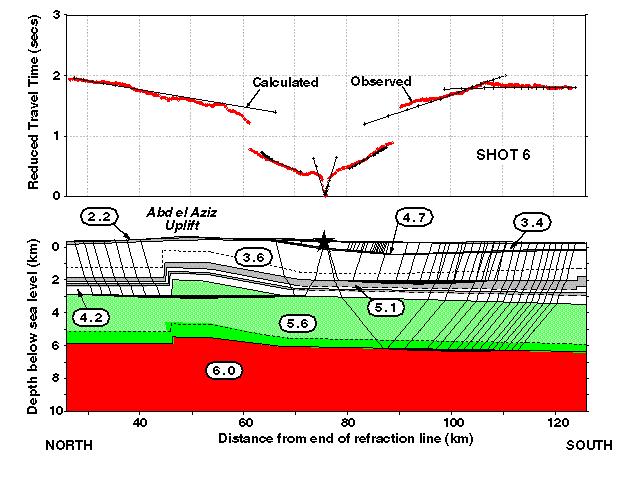
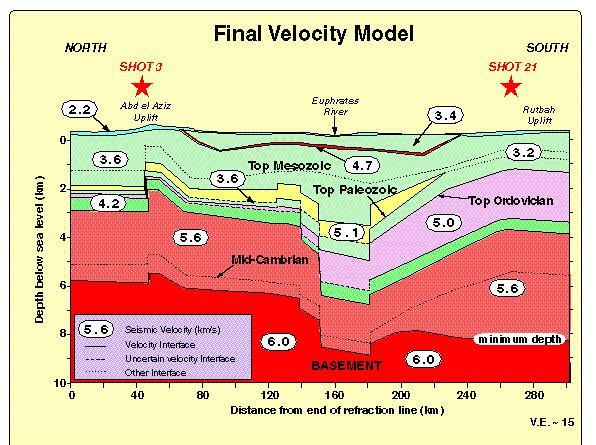
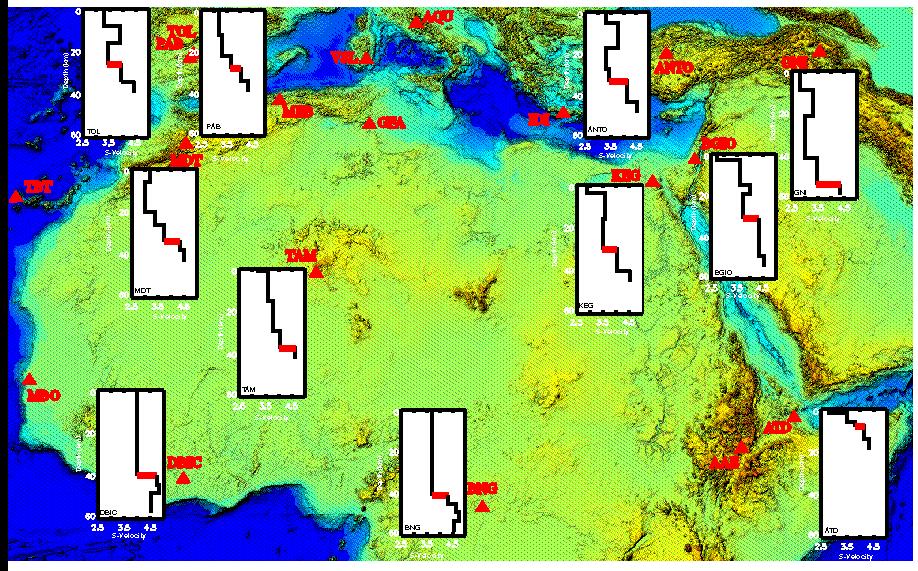
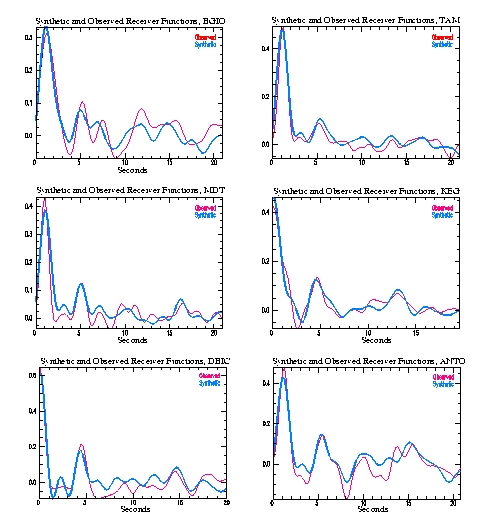
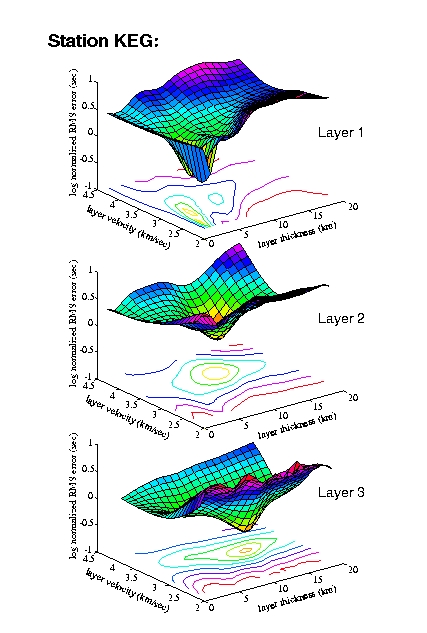
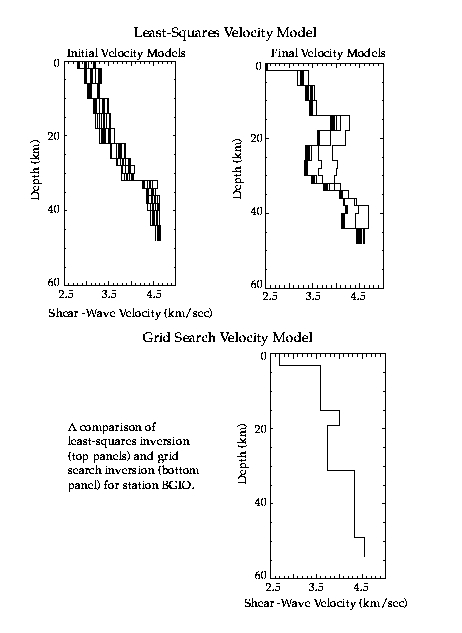